HelpDesk
How to Create a Release Burn-Down Chart Using ConceptDraw PRO

HelpDesk
Agile Mind Maps: Exploring the User Wishes

This TQM diagram sample was redesigned from the illustration of "Inland acid sulfate soil and water quality fact sheet" from website of the Department of the Environment of the Australian Government.
[environment.gov.au/ resource/ inland-acid-sulfate-soil-and-water-quality-fact-sheet]
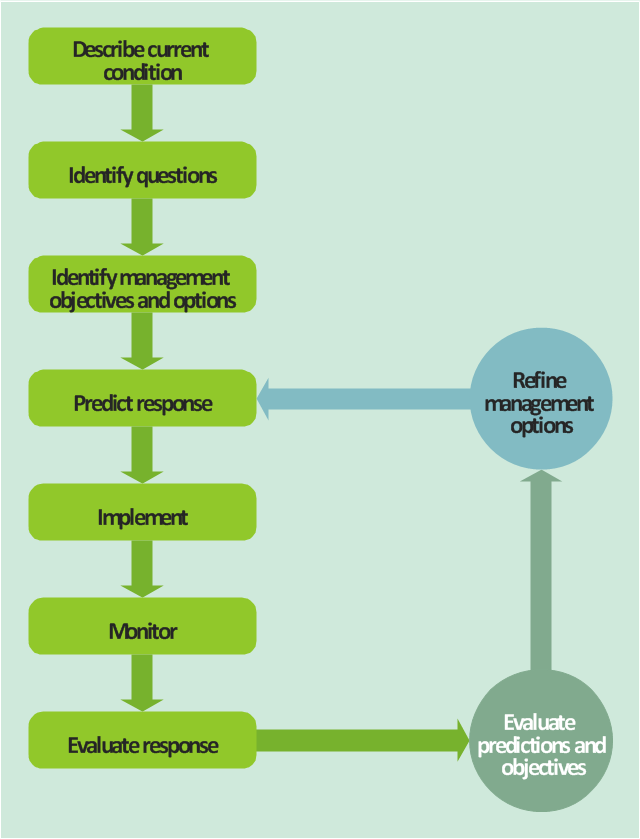
"Adaptive management (AM), also known as adaptive resource management (ARM), is a structured, iterative process of robust decision making in the face of uncertainty, with an aim to reducing uncertainty over time via system monitoring. In this way, decision making simultaneously meets one or more resource management objectives and, either passively or actively, accrues information needed to improve future management. Adaptive management is a tool which should be used not only to change a system, but also to learn about the system (Holling 1978). Because adaptive management is based on a learning process, it improves long-run management outcomes. The challenge in using the adaptive management approach lies in finding the correct balance between gaining knowledge to improve management in the future and achieving the best short-term outcome based on current knowledge (Allan & Stankey 2009)." [Adaptive management. Wikipedia]
The TQM flowchart example "Acid sulfate soil adaptive management framework" was created using the ConceptDraw PRO diagramming and vector drawing software extended with the Total Quality Management (TQM) Diagrams solution from the Quality area of ConceptDraw Solution Park.
[environment.gov.au/ resource/ inland-acid-sulfate-soil-and-water-quality-fact-sheet]
"Adaptive management (AM), also known as adaptive resource management (ARM), is a structured, iterative process of robust decision making in the face of uncertainty, with an aim to reducing uncertainty over time via system monitoring. In this way, decision making simultaneously meets one or more resource management objectives and, either passively or actively, accrues information needed to improve future management. Adaptive management is a tool which should be used not only to change a system, but also to learn about the system (Holling 1978). Because adaptive management is based on a learning process, it improves long-run management outcomes. The challenge in using the adaptive management approach lies in finding the correct balance between gaining knowledge to improve management in the future and achieving the best short-term outcome based on current knowledge (Allan & Stankey 2009)." [Adaptive management. Wikipedia]
The TQM flowchart example "Acid sulfate soil adaptive management framework" was created using the ConceptDraw PRO diagramming and vector drawing software extended with the Total Quality Management (TQM) Diagrams solution from the Quality area of ConceptDraw Solution Park.
TQM diagram
- Iterative Flow Chart
- Basic Flowchart Symbols and Meaning | Agile Methodology | Scrum ...
- Basic Flowchart Symbols and Meaning | Process Flowchart ...
- Basic Flowchart Symbols and Meaning | Yourdon and Coad ...
- Flowchart Software Iteration
- Flowchart Software Iterative Or Iteration Example
- Basic Flowchart Symbols and Meaning | Process Flowchart ...
- Basic Flowchart Symbols and Meaning | Process Flowchart ...
- Basic Flowchart Symbols and Meaning | Process Flowchart ...
- PM Response | PM Easy | PM Agile | Iterative Planning Pm Flow Chart
- Workflow to Make a Purchase. Accounting Flowchart Example ...
- Cross-Functional Flowchart (Swim Lanes) | Swim Lane Diagrams ...
- Yourdon and Coad Diagram | Data Flow Diagram Examples | Data ...
- Coad/Yourdon's Object-Oriented Analysis model | Data Flow ...
- Coad/Yourdon's Object-Oriented Analysis model | Data Flow ...
- Simple Flow Chart | Flowchart Process Example | Vicious circle ...
- Basic Diagramming | Virtuous circle (management) - Ring chart ...
- PM Easy | How to Report Task's Execution with Gantt Chart | Garrett ...
- Types of Flowcharts | Material Requisition Flowchart . Flowchart ...
- Workflow to Make a Purchase. Accounting Flowchart Example ...
- ERD | Entity Relationship Diagrams, ERD Software for Mac and Win
- Flowchart | Basic Flowchart Symbols and Meaning
- Flowchart | Flowchart Design - Symbols, Shapes, Stencils and Icons
- Flowchart | Flow Chart Symbols
- Electrical | Electrical Drawing - Wiring and Circuits Schematics
- Flowchart | Common Flowchart Symbols
- Flowchart | Common Flowchart Symbols