Basic Flowchart Symbols and Meaning


Process Flowchart


"In mathematics, the Euclidean algorithm, or Euclid's algorithm, is a method for computing the greatest common divisor (GCD) of two (usually positive) integers, also known as the greatest common factor (GCF) or highest common factor (HCF). ...
The GCD of two positive integers is the largest integer that divides both of them without leaving a remainder (the GCD of two integers in general is defined in a more subtle way).
In its simplest form, Euclid's algorithm starts with a pair of positive integers, and forms a new pair that consists of the smaller number and the difference between the larger and smaller numbers. The process repeats until the numbers in the pair are equal. That number then is the greatest common divisor of the original pair of integers.
The main principle is that the GCD does not change if the smaller number is subtracted from the larger number. ... Since the larger of the two numbers is reduced, repeating this process gives successively smaller numbers, so this repetition will necessarily stop sooner or later - when the numbers are equal (if the process is attempted once more, one of the numbers will become 0)." [Euclidean algorithm. Wikipedia]
The flowchart example "Euclidean algorithm" was created using the ConceptDraw PRO diagramming and vector drawing software extended with the Mathematics solution from the Science and Education area of ConceptDraw Solution Park.
Euclid's algorithm flow chart

Agile Methodology

Yourdon and Coad Diagram

BPR Diagram. Business Process Reengineering Example

Scrum process work items and workflow

SSADM Diagram

The example below illustrates the waterfall model used in SSADM. This model involves 5 stages of developing a product such as requirements specification and its' analysis, design, coding and testing.
Scrum

WBS Diagram

ER diagram tool for OS X

 Basic Circular Arrows Diagrams
This solution extends ConceptDraw PRO v10 (or later) with samples, templates, and a library of vector stencils for drawing circular arrow diagrams.
Scrum workflow

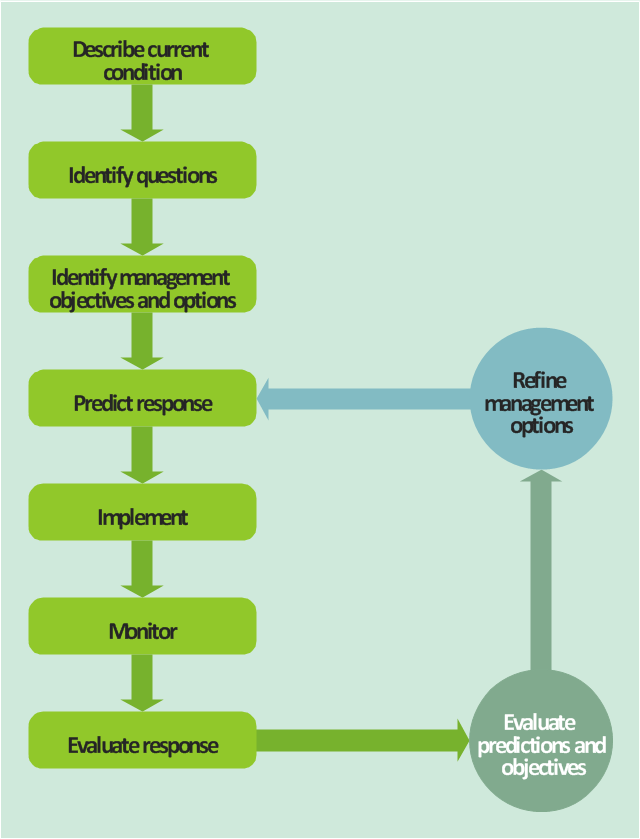
This TQM diagram sample was redesigned from the illustration of "Inland acid sulfate soil and water quality fact sheet" from website of the Department of the Environment of the Australian Government.
[environment.gov.au/ resource/ inland-acid-sulfate-soil-and-water-quality-fact-sheet]
"Adaptive management (AM), also known as adaptive resource management (ARM), is a structured, iterative process of robust decision making in the face of uncertainty, with an aim to reducing uncertainty over time via system monitoring. In this way, decision making simultaneously meets one or more resource management objectives and, either passively or actively, accrues information needed to improve future management. Adaptive management is a tool which should be used not only to change a system, but also to learn about the system (Holling 1978). Because adaptive management is based on a learning process, it improves long-run management outcomes. The challenge in using the adaptive management approach lies in finding the correct balance between gaining knowledge to improve management in the future and achieving the best short-term outcome based on current knowledge (Allan & Stankey 2009)." [Adaptive management. Wikipedia]
The TQM flowchart example "Acid sulfate soil adaptive management framework" was created using the ConceptDraw PRO diagramming and vector drawing software extended with the Total Quality Management (TQM) Diagrams solution from the Quality area of ConceptDraw Solution Park.
TQM diagram
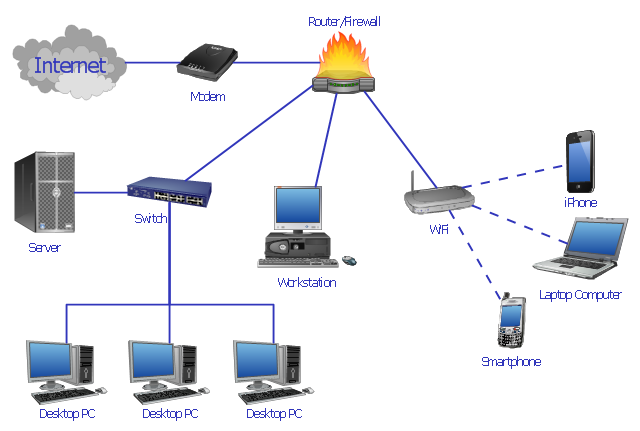
"Network planning and design is an iterative process, encompassing topological design, network-synthesis, and network-realization, and is aimed at ensuring that a new telecommunications network or service meets the needs of the subscriber and operator. Network planning process involves three main steps: 1) Topological design: This stage involves determining where to place the components and how to connect them. 2) Network-synthesis: This stage involves determining the size of the components used, subject to performance criteria such as the Grade of Service (GoS). 3) Network realization: This stage involves determining how to meet capacity requirements, and ensure reliability within the network." [Network planning and design. Wikipedia]
This computer network system design diagram example was created using the ConceptDraw PRO diagramming and vector drawing software extended with the Computer and Networks solution from the Computer and Networks area of ConceptDraw Solution Park.
This computer network system design diagram example was created using the ConceptDraw PRO diagramming and vector drawing software extended with the Computer and Networks solution from the Computer and Networks area of ConceptDraw Solution Park.
Network system design
- Basic Flowchart Symbols and Meaning | Agile Methodology | Scrum ...
- Basic Flowchart Symbols and Meaning | Process Flowchart ...
- Basic Flowchart Symbols and Meaning | Process Flowchart ...
- Basic Flowchart Symbols and Meaning | Process Flowchart | Agile ...
- Iterative Flow Chart
- Flowchart Software Iterative Or Iteration Example
- Basic Flowchart Symbols and Meaning | Yourdon and Coad ...
- Basic Flowchart Symbols and Meaning | Process Flowchart | BPR ...
- Basic Flowchart Symbols and Meaning | Process Flowchart ...
- Scrum sprint cycle | Target and Circular Diagrams | Iteration Loop ...
- Basic Flowchart Symbols and Meaning | Process Flowchart | BPR ...
- Process Flowchart | Basic Flowchart Symbols and Meaning ...
- Workflow Diagram Examples | Work Flow Process Chart | Process ...
- Solving quadratic equation algorithm - Flowchart | Types of ...
- Radial Tasks Diagram
- How to Draw a Computer Network Diagrams | Process Flowchart ...
- Research cycle - Circle diagram | Innovation life cycle - Arrow loop ...
- Water cycle diagram | Strategic planning - Cycle diagram ...
- Data Flow Diagram Symbols. DFD Library | Coad/Yourdon's Object ...
- Circle Bullet
- ERD | Entity Relationship Diagrams, ERD Software for Mac and Win
- Flowchart | Basic Flowchart Symbols and Meaning
- Flowchart | Flowchart Design - Symbols, Shapes, Stencils and Icons
- Flowchart | Flow Chart Symbols
- Electrical | Electrical Drawing - Wiring and Circuits Schematics
- Flowchart | Common Flowchart Symbols
- Flowchart | Common Flowchart Symbols