 ConceptDraw Solution Park
ConceptDraw Solution Park collects graphic extensions, examples and learning materials
 Seven Management and Planning Tools
Seven Management and Planning Tools solution extends ConceptDraw DIAGRAM and ConceptDraw MINDMAP with features, templates, samples and libraries of vector stencils for drawing management mind maps and diagrams.
HelpDesk
How to Make Network Diagram

 Entity-Relationship Diagram (ERD)
Entity-Relationship Diagram (ERD) solution extends ConceptDraw DIAGRAM software with templates, samples and libraries of vector stencils from drawing the ER-diagrams by Chen's and crow’s foot notations.
Software Diagram Examples and Templates

Software Development area of ConceptDraw Solution Park provides 5 solutions:
Data Flow Diagrams, Entity-Relationship Diagram (ERD), Graphic User Interface, IDEFO Diagrams, Rapid UML.
HelpDesk
How to Create a TQM Diagram Using Total Quality Management Diagrams Solution

HelpDesk
How to Make a Workflow Diagram

HelpDesk
How to Create an Entity-Relationship Diagram

ConceptDraw DIAGRAM Network Diagram Tool


HelpDesk
How to Develop a Business Process Model

HelpDesk
Event-driven Process Chain (EPC) Diagram Software

An EPC diagram shows different business processes through various workflows. The workflows are seen as functions and events that are connected by different teams or people, as well as tasks that allow business processes to be executed. The best thing about this type of enterprise modeling is that creating an EPC diagram is quick and simple as long as you have the proper tool. One of the main usages of the EPC diagrams is in the modeling, analyzing and re-engineering of business processes. With the use of the flowchart, businesses are able to see inefficiencies in the processes and modify to make them more productive. Event-driven process chain diagrams are also used to configure an enterprise resource plan.
HelpDesk
How to Create a Data Flow Diagram

 Diagrams Area
Solutions of the area Diagrams from ConceptDraw Solution Park collect templates, samples and vector stencils libraries for drawing diagrams visualizing qualitative information and knowledge.
HelpDesk
How to Create a BPMN Diagram

HelpDesk
How to Create an IDEF0 Diagram for an Application Development

HelpDesk
How to Create a CCTV Diagram

CCTV diagram should include the scheme of strategic placement of video cameras, which capture and transmit videos to either a private network of monitors for real-time viewing or to a video recorder for later reference. CCTV is commonly used for surveillance and security purposes. Using ConceptDraw DIAGRAM with the Security and Access Plans Solution lets you create professional looking video surveillance CCTV system plans, security plans, and access schemes.
HelpDesk
How to Draw a Circle-Spoke Diagram

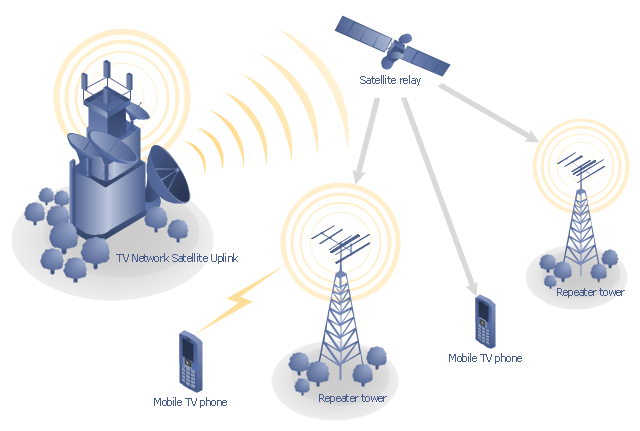
"Satellite television is television programming delivered by the means of communications satellite and received by an outdoor antenna, usually a parabolic reflector generally referred to as a satellite dish, and as far as household usage is concerned, a satellite receiver either in the form of an external set-top box or a satellite tuner module built into a TV set. Satellite TV tuners are also available as a card or a USB peripheral to be attached to a personal computer. In many areas of the world satellite television provides a wide range of channels and services, often to areas that are not serviced by terrestrial or cable providers.
Direct-broadcast satellite television comes to the general public in two distinct flavors - analog and digital. This necessitates either having an analog satellite receiver or a digital satellite receiver. Analog satellite television is being replaced by digital satellite television and the latter is becoming available in a better quality known as high-definition television." [Satellite television. Wikipedia]
"Mobile television is television watched on a small handheld or mobile device. It includes pay TV service delivered via mobile phone networks or received free-to-air via terrestrial television stations. Regular broadcast standards or special mobile TV transmission formats can be used. Additional features include downloading TV programs and podcasts from the internet and the ability to store programming for later viewing. ...
Mobile TV is among the features provided by many 3G phones." [Mobile television. Wikipedia]
"MobiTV, Inc. ... is a provider of end-to-end mobile media solutions. In 2011, the cloud-based MobiTV converged media platform delivered 1.6 billion minutes of live TV, video-on-demand and downloaded content for offline viewing to all tier-one wireless carriers and major mobile operating systems in the United States. ...
MobiTV furnishes programming from more than 40 television channels, offering live news and sports and a variety of full-episode on-demand shows for streaming or download on mobile devices, tablets, personal computers and other Internet-enabled consumer electronics.
MobiTV-powered TV services, which carry the operator’s brand, are accessible on hundreds of devices across multiple wireless carrier partners. ...
MobiTV’s converged media platform is an end-to-end managed service comprising components that work together to securely manage, deliver and play back video across devices both inside and outside the home." [MobiTV. Wikipedia]
This mobile satellite TV network diagram example was created using the ConceptDraw PRO diagramming and vector drawing software extended with the Telecommunication Network Diagrams solution from the Computer and Networks area of ConceptDraw Solution Park.
Mobile satellite TV diagram
HelpDesk
How to Create an Enterprise Architecture Diagram

HelpDesk
How to Create a Timeline Diagram

- Root cause analysis tree diagram
- Entity-Relationship Diagram (ERD) | PROBLEM ANALYSIS ...
- UML Activity Diagram | Diagramming Software for Design UML ...
- Activity Network (PERT) Chart | ConceptDraw PRO Network ...
- Root cause analysis tree diagram - Manufacturing problem solution
- Network Topology | Network Diagram Software | Visio Look a Like ...
- Root cause analysis tree diagram template | Fault Tree Diagram ...
- UML Component Diagram
- Entity-Relationship Diagram (ERD) | Software development with ...
- Collaboration BPMN 2.0 diagram - Cab booking public process ...
- Network Diagram Examples | Bus network topology diagram | Basic ...
- UML activity diagram - Cash withdrawal from ATM | UML Activity ...
- UML communication diagram template
- UML Deployment Diagram | Diagramming Software for Design UML ...
- Fishbone Diagram | Business Productivity Diagramming ...
- Collaboration BPMN diagram - Application handling and invoicing ...
- ConceptDraw PRO Network Diagram Tool | Computer and Networks ...
- Data flow diagram
- Pyramid diagram template | Arrowed block pyramid template ...
- Value Stream Mapping | Entity-Relationship Diagram (ERD ...
- ERD | Entity Relationship Diagrams, ERD Software for Mac and Win
- Flowchart | Basic Flowchart Symbols and Meaning
- Flowchart | Flowchart Design - Symbols, Shapes, Stencils and Icons
- Flowchart | Flow Chart Symbols
- Electrical | Electrical Drawing - Wiring and Circuits Schematics
- Flowchart | Common Flowchart Symbols
- Flowchart | Common Flowchart Symbols