HelpDesk
How to Add a Bubble Diagram to a PowerPoint Presentation Using ConceptDraw PRO
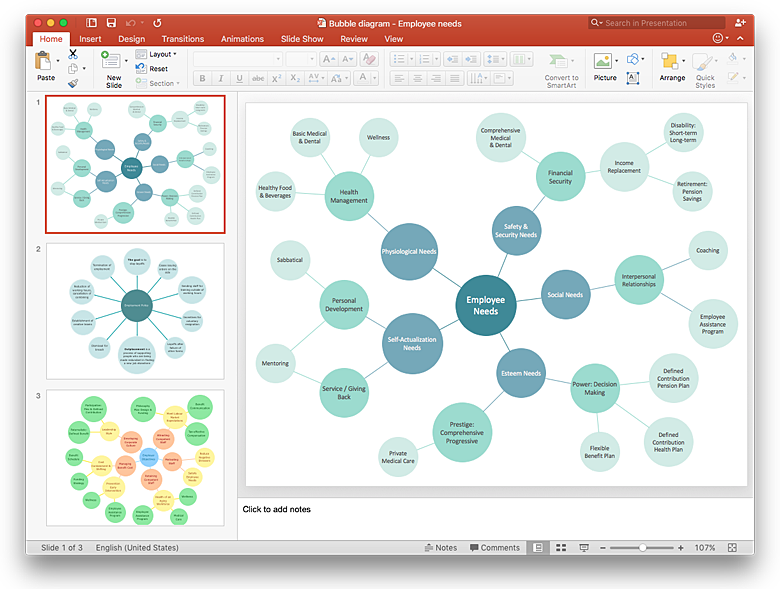
Bubble diagrams can be used to compare concepts, and identify areas of similarity and difference. ConceptDraw PRO allows you to make a MS PowerPoint Presentation from your charts in a few simple steps. A bubble diagram is a chart that represents information visually in the form of series of bubbles. Bubble charts are often used in marketing and management during the early stages of product development to visualize ideas and concepts by organizing them in a hierarchy. The ability to create this form of diagram is contained within the Bubble Diagrams solution. A PowerPoint presentation of bubble diagrams can be used to demonstrate and identify areas of similarity and difference of featured business ideas and concepts.HelpDesk
How to Manage Problem Solving Using Seven Management and Planning Tools
Stage by stage gouide on using visual tools to move toward solving the problem.
HelpDesk
How to Convert a Visio Stencils for Use in ConceptDraw PRO
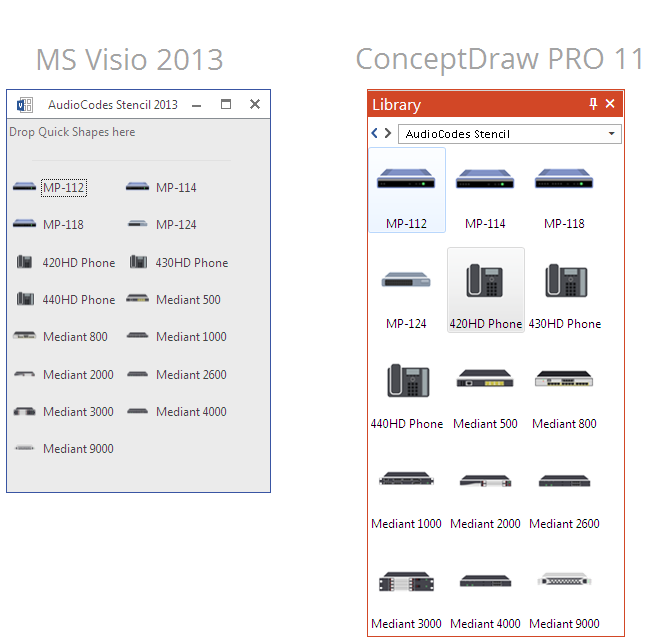
MS Visio provides users with a number of predefined stencils. Standard Visio stencils contain shapes that are basically used to create diagrams. The shapes can range from simple flow chart boxes or lines to more complicated shapes like servers, racks or anything else that needs to be represented in a graphical form. ConceptDraw PRO supports the possibility to open Visio stencils. With the introduction of Visio 2013 Microsoft has changed the native file format used in earlier versions of Microsoft Visio. Thus, when you are looking for professional tool to open and save in the newer Visio 2013 file format on Mac, ConceptDraw PRO v10 is exactly solution for you. ConceptDraw PRO v10 file import and export works round-trip with the new Visio VSDX file format and at the same time supports the improved import of VDX file format. To use Visio stencils created with MS Visio 2010 in your diagrams, created with ConceptDraw PRO, follow the steps described in the following article.
 Computer and Networks Area
The solutions from Computer and Networks Area of ConceptDraw Solution Park collect samples, templates and vector stencils libraries for drawing computer and network diagrams, schemes and technical drawings.
HelpDesk
How to Add a Circle-spoke Diagram to a PowerPoint Presentation Using ConceptDraw PRO
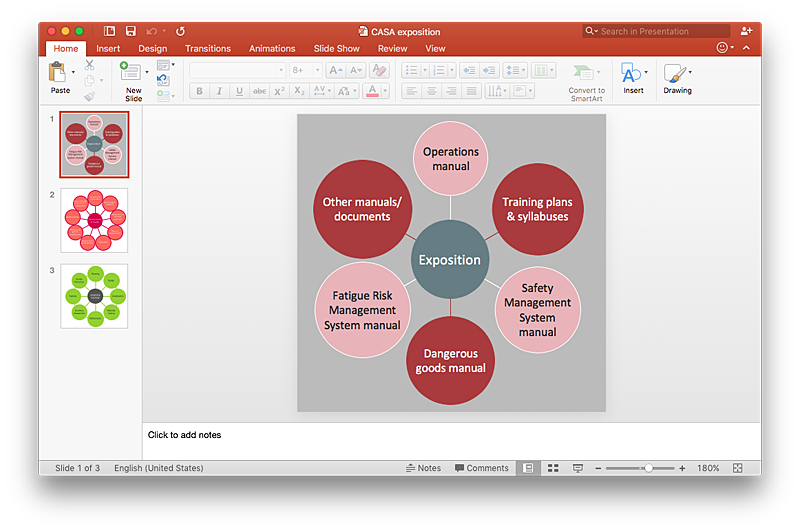
ConceptDraw PRO can be used as a tool for creating circle spoke diagrams along with other marketing diagrams. ConceptDraw PRO allows you to make a MS PowerPoint Presentation from your marketing diagrams in a few simple steps.HelpDesk
How to Convert a Mind Map into MS Word Document
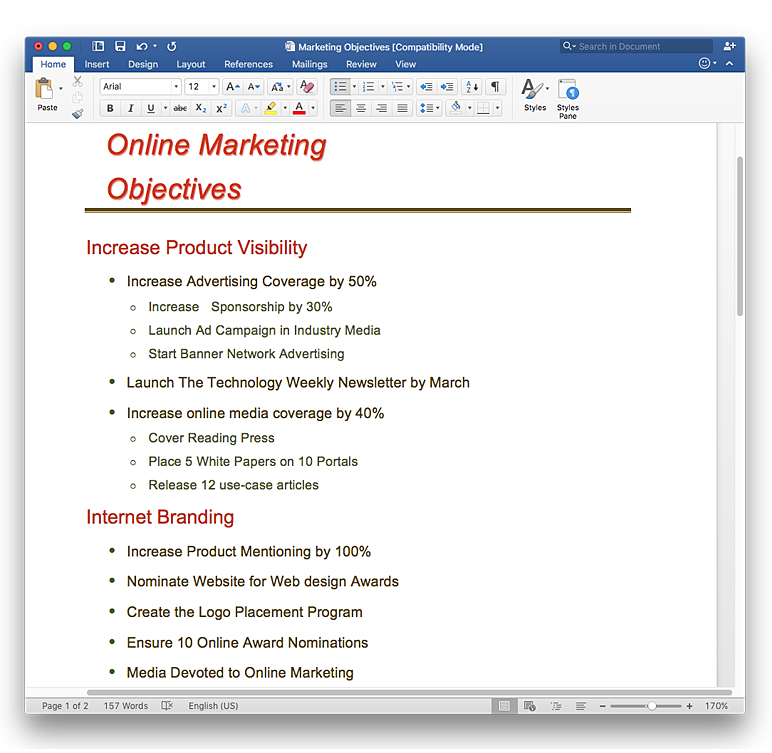
Mind maps are often used for structuring ideas, planning and organizing of various documents. ConceptDraw MINDMAP allows you transfer a mind map to MS Word format using its export facilities. You can convert a mind map to a MS Word outline using the set of standard templates, or even your custom template. Thus, your mind map will be transformed into the proper document format. Using a custom MS Word template allows you apply your individual style to each document, being exported from ConceptDraw MINDMAP. You can use a mind mapping to capture ideas and structure information. Then making a quick conversion to MS Word and you finally obtain a clean and stylish document.
 ConceptDraw Solution Park
ConceptDraw Solution Park collects graphic extensions, examples and learning materials
HelpDesk
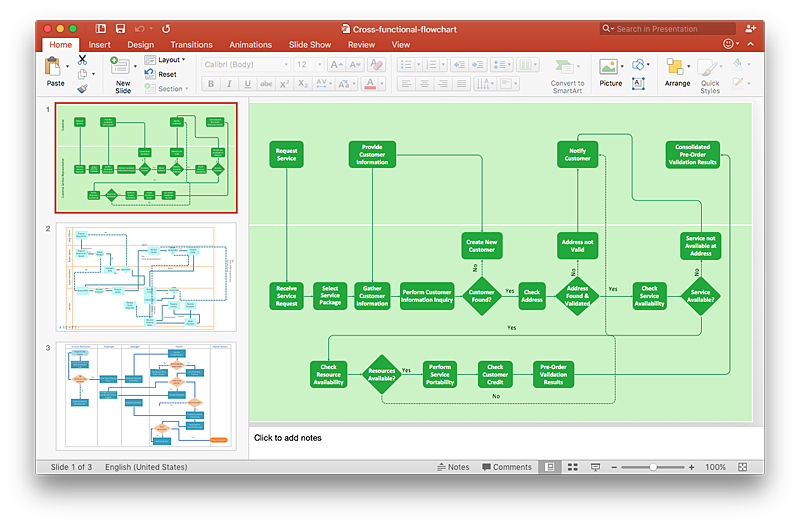
How to Add a Cross-Functional Flowchart to a PowerPoint Presentation Using ConceptDraw PRO
Using a Cross-Functional flowchart is a clear way of showing how business processes get shared or transferred between different teams and departments. ConceptDraw PRO allows you to make an MS PowerPoint Presentation from your flowcharts in a few simple steps.HelpDesk
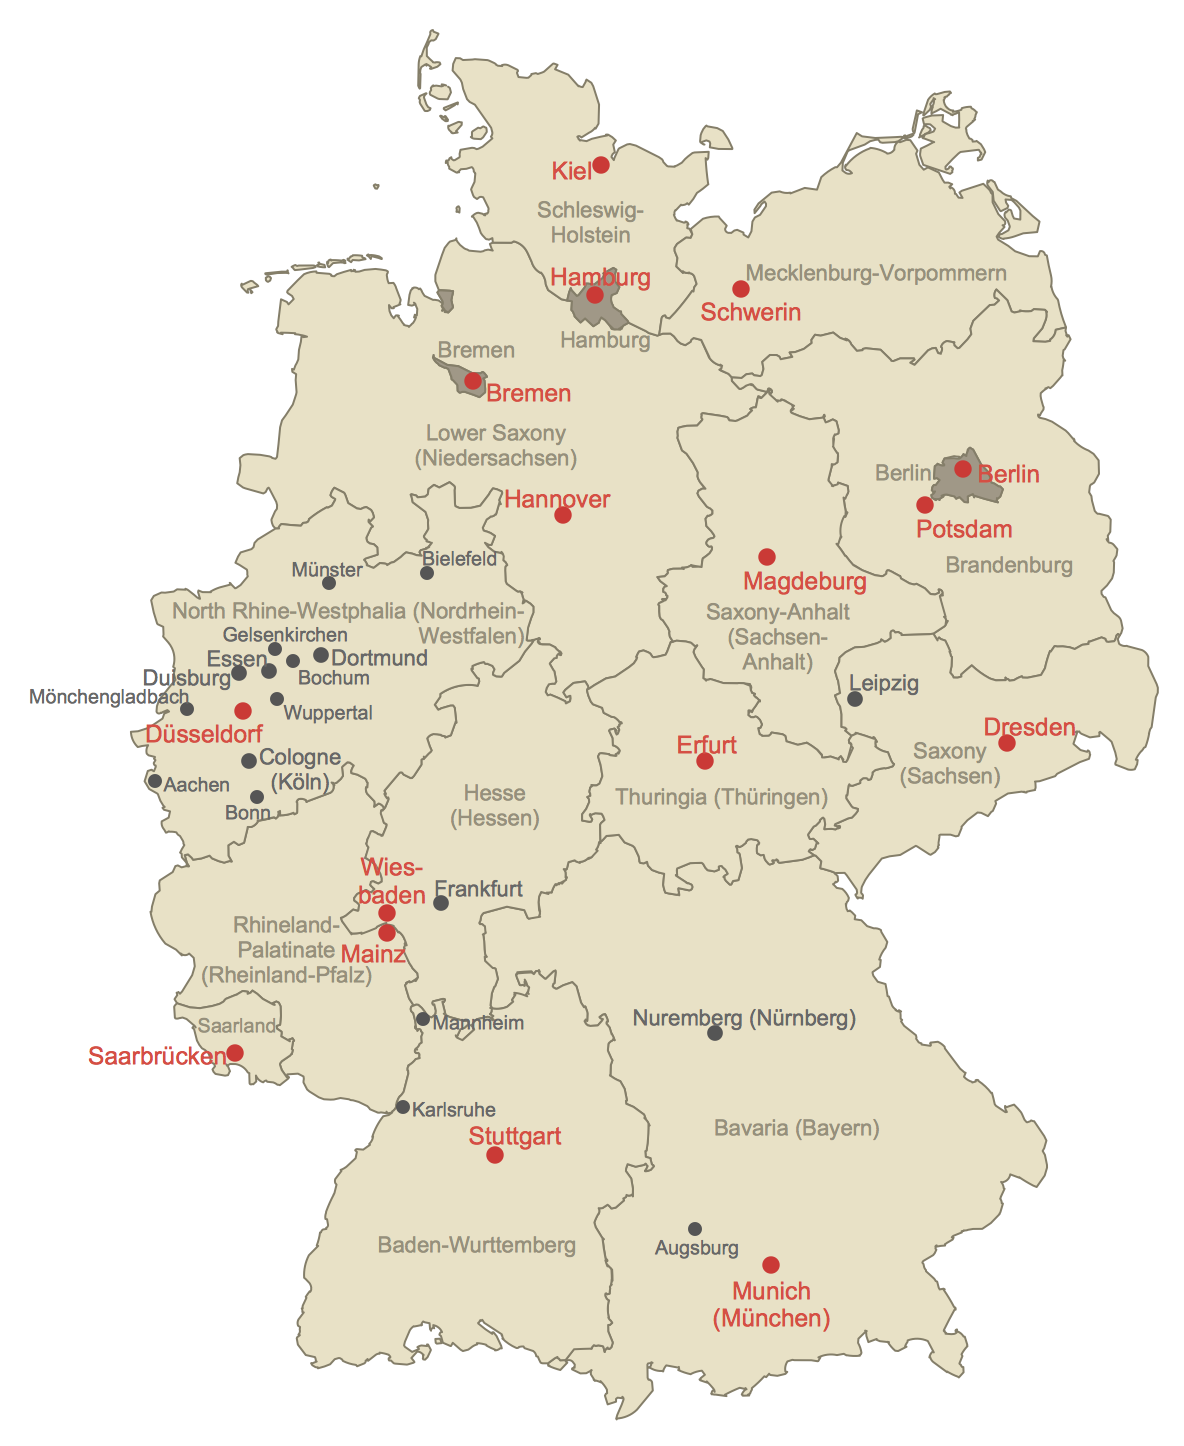
How to Create a Map of Germany Using ConceptDraw PRO
Geographical thematic maps are used to display information on a variety of subjects. It is a common way of representing any form of spatial data in relation to a specific geographical area. The Germany Map Solution for ConceptDraw PRO includes all of the German federal states with county outlined borders and major cities. You can quickly create geographic maps, cartograms, and thematic maps for geographical visualization information for business and travels.HelpDesk
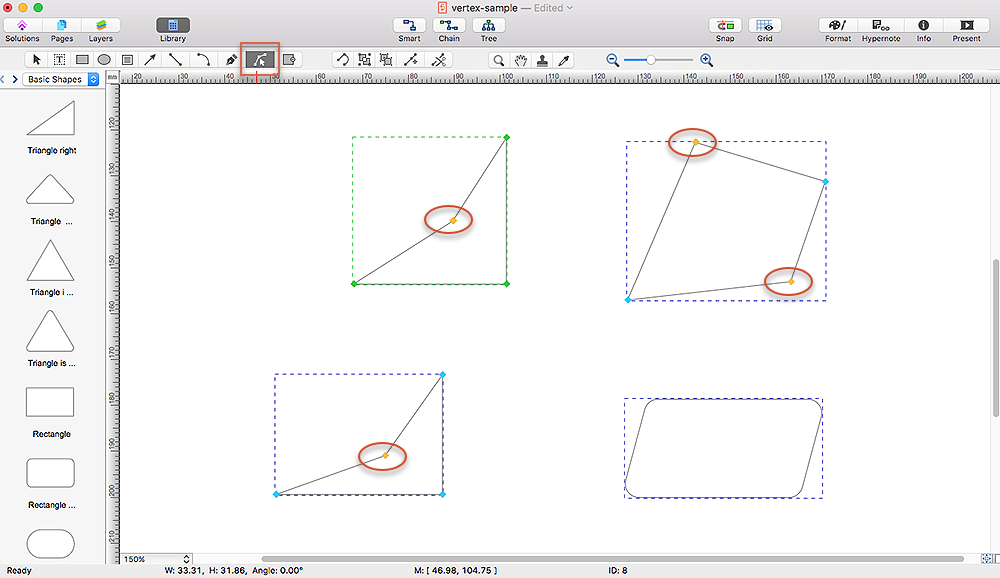
How to Reshape an Object on the Mac Using Vertex Tool
Create your own custom objects using the elements of Basic Shapes library. To create complex objecrts or change existing ones in ConceptDraw PRO , you can usethe Vertex tool. Using vertexes you can modify the geometry of any object in ConceptDraw PRO.
HelpDesk
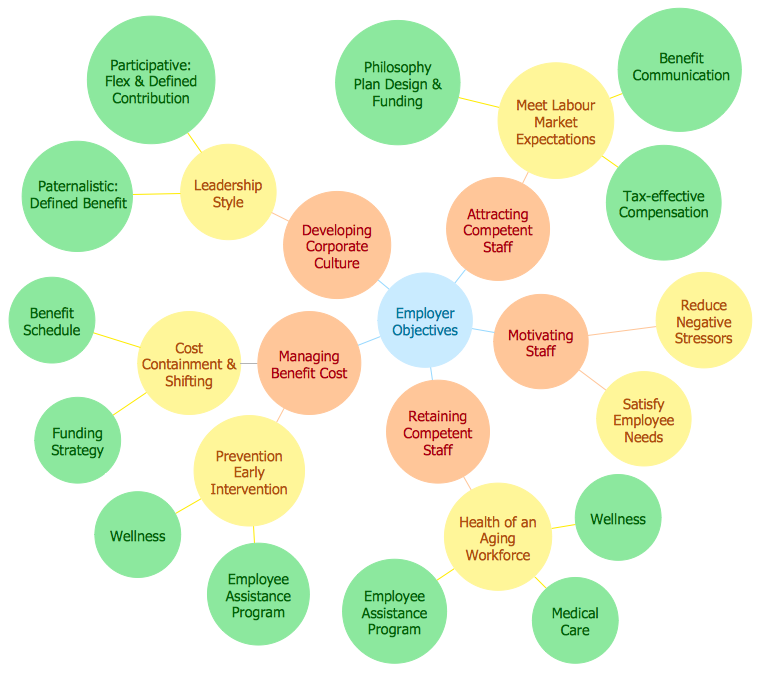
How to Create a Bubble Diagram Using ConceptDraw PRO
Bubble Diagram is a simple chart that consists of circles (bubbles) repesening certain topics or processes. Bubbles are connected by lines depicting the type of relationships between the bubbles. The size of each bubble is depended on the importance of the entity it represents. Bubble charts are widely used throughout social, economical, medical, and other scientific researches as well as throughout architecture and business management. Bubble charts are often used during the early stages of product development to visualize thoughts and ideas for the purpose of sketching out a development plan. ConceptDraw PRO allows you to draw a bubble diagrams using the Bubble Diagrams solution.HelpDesk
How to Make Soccer Position Diagram Using ConceptDraw PRO
The soccer field has the form of a large rectangle, covered with grass. Dimensions of soccer fields may vary slightly, depending on the level of the game, but all fields have some common characteristics. Soccer players may take different positions. Each soccer position has its own name, and implies certain player functions. Every soccer position has a very specific name and task: Goalkeeper, Defenders, Midfielders and Forwards. During preparation for the game coach met a challenge: how to explain each player's position and his role in the game. The difficulty is the fact that in the course of the game players will often move on the field and do not stay in one place. Football field diagram with dimensions and marking, and positions - it is an important tool for the coach. ConceptDraw PRO helps both coach and players to understand exactly their roles during the particular game. The ability to create Soccer diagrams is contained in the ConceptDraw Soccer solution. The solution providesHelpDesk
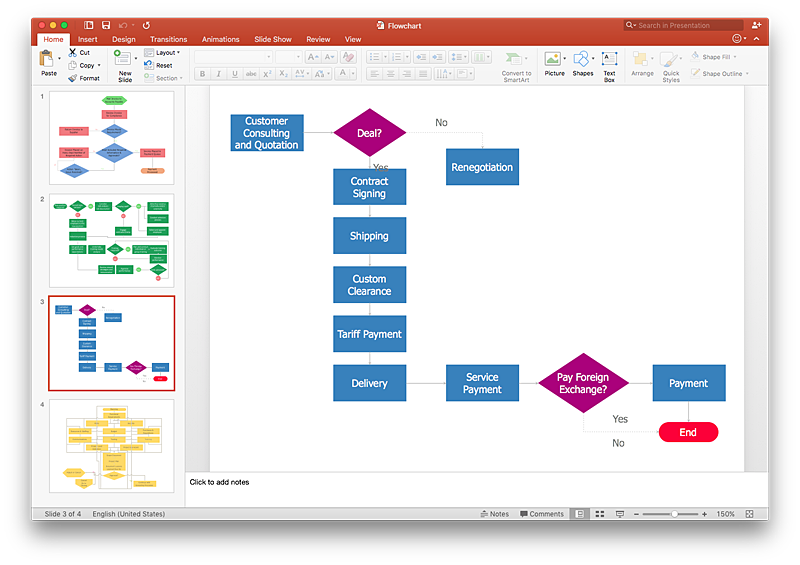
How To Make a PowerPoint Presentation of Flowcharts Using ConceptDraw PRO
ConceptDraw PRO allows you to create professional flowchart quickly and easily. The ability to create flowcharts is contained in the Flowcharts solution. To submit flowcharts for the audience, you can use export to MS PowerPoint.HelpDesk
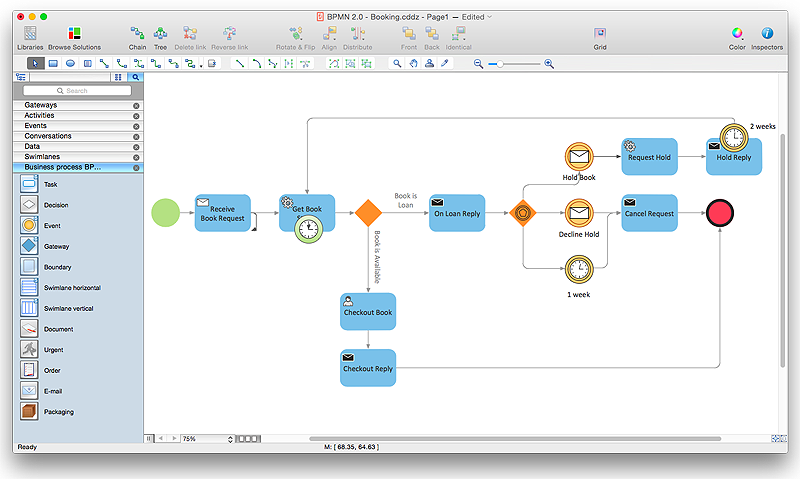
How to Create a BPMN Diagram Using ConceptDraw PRO
Business Process Modeling Notation (BPMN) is a method of illustrating business processes in the form of a diagram. The most effective method of creating or analyzing a business process is to visually interpret the steps using a business process diagram, flowchart or workflow. This is known as business process modeling, and will be performed within a company by a team who have detailed knowledge of company process, and analysts with expertise in the modeling discipline. The objective is often to increase production or lower costs — by modeling the process initially using a flowchart, inefficiencies and problems can be spotted before committing to a decision or strategy. You can create BPMN diagrams using the ConceptDraw PRO diagramming tools. ConceptDraw have designed a solution that combines BPMN v2.0 methodology and graphical notification into one powerful package. The Business Process Diagrams solution from ConceptDraw Solution Park provides a comprehensive collection of vector- Order Request
- PERT chart - Project management plan | PERT chart - Template ...
- UML state machine diagram - Template | Diagramming Software for ...
- SWOT Matrix Template | SWOT Analysis | SWOT analysis for a small ...
- 5s Diagram Template Form
- Completed transition schematic - IDEF3 diagram | Transition ...
- SWOT Matrix Template | Matrices | How To Create an Involvement ...
- SWOT Matrix Template | SWOT analysis matrix diagram templates ...
- Template Order Form
- Template Swot Matrix
- New business opportunity SWOT analysis matrix - Template portrait ...
- SWOT Matrix Template | PROBLEM ANALYSIS. Prioritization Matrix ...
- Remote Projects in Corporate Strategy | Build Strategies ...
- IDEF3 Standard | How to create an IDEF3 diagram using ...
- Example Of Application Form Flow Chart
- Picture graph template | Design elements - Picture graphs | Graphs ...
- SWOT analysis matrix diagram templates | New business ...
- Employment Form Software | Bubble diagram - Employment policy ...
- UML Diagrams with ConceptDraw PRO | Form Maker ...
- How to Create SWOT Analysis Template in ConceptDraw PRO ...
- ERD | Entity Relationship Diagrams, ERD Software for Mac and Win
- Flowchart | Basic Flowchart Symbols and Meaning
- Flowchart | Flowchart Design - Symbols, Shapes, Stencils and Icons
- Flowchart | Flow Chart Symbols
- Electrical | Electrical Drawing - Wiring and Circuits Schematics
- Flowchart | Common Flowchart Symbols
- Flowchart | Common Flowchart Symbols
