Basic Flowchart Symbols and Meaning


Quality Control Chart Software — ISO Flowcharting

The quality control chart is a graphic that illustrates the accordance of processes or products to the intended specifications and degree of differences from them. Depending on what type of data you need analyze, there are used different types of quality control charts: X-bar charts, S charts, Np charts.
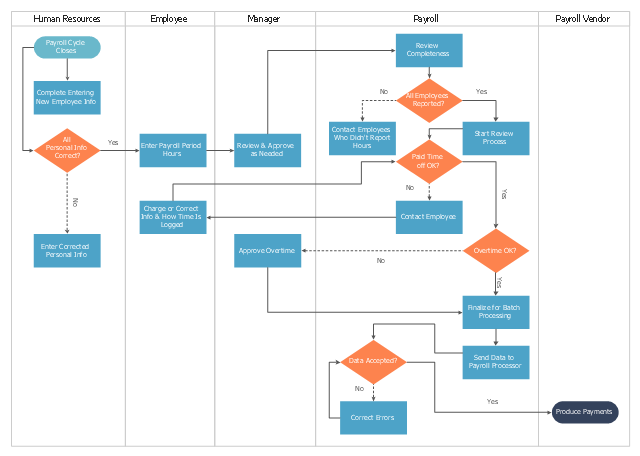
This cross-functional flowchart sample represents the payroll process mapping.
"Business process mapping refers to activities involved in defining what a business entity does, who is responsible, to what standard a business process should be completed, and how the success of a business process can be determined.
The main purpose behind business process mapping is to assist organizations in becoming more efficient. A clear and detailed business process map or diagram allows outside firms to come in and look at whether or not improvements can be made to the current process.
Business process mapping takes a specific objective and helps to measure and compare that objective alongside the entire organization's objectives to make sure that all processes are aligned with the company's values and capabilities.
ISO 9001 requires a business entity to follow a process approach when managing its business, and to this end creating business process maps will assist. The entity can then work towards ensuring its processes are effective (the right process is followed the first time), and efficient (continually improved to ensure processes use the smallest amount of resources)." [Business process mapping. Wikipedia]
The business process map example "Swim lane diagram - Payroll process mapping" was drawn using the ConceptDraw PRO diagramming and vector drawing software extended with the Cross-Functional Flowcharts solution from the Business Processes area of ConceptDraw Solution Park.
Cross-functional flowchart
 Business Process Mapping
The Business Process Mapping solution for ConceptDraw DIAGRAM is for users involved in process mapping and creating SIPOC diagrams.
Types of Flowcharts


Flowchart design. Flowchart symbols, shapes, stencils and icons

Mavericks have always desired to stand apart and gorgeous design is the recipe for that. Any business graphic document will be more understandable if will use an expository color scheme for their parts. Flowchart design makes versatile presenting and explaining of the process and gives a fresh view that distinguishes it from black and white flowcharts on a paper. Workflow diagram or process flow diagrams become more understandable to ordinary people when it use minimum symbols and special signs.
The best design can be accomplished by starting from any of the suitable Conceptdraw examples. Pick one of them and begin to input proper text into each Flowchart symbols and shapes. Apply less colors in the document and don't turn into rainbow your diagram, three or four will be enough, also note that business process flowchart may not contain bright color hues. The next clue is to use identical colors for same flowchart shape types.

Accounts Payable Flowchart

The Accounting Flowcharts Solution contains templates, samples and library of ready-to-use predesigned vector objects that will help you create: accounts payable flowchart, accounts payable process flow chart, accounting flowchart of any complexity quick and easy.
Audit Flowchart Symbols

Audit Flowchart Symbols - It’s efficiently to use the colors creating the audit flowcharts to make them bright, visual, attractive and successful. The best flowchart maker use ConceptDraw DIAGRAM features of RapidDraw technique.
Flow chart Example. Warehouse Flowchart

Standard warehousing process flow diagram and standard workflow diagram used for process identification for further evaluating effectiveness and profitability of overall business process. Use the ConceptDraw DIAGRAM diagramming and vector drawing software extended with the Flowcharts solution from the Diagrams area of ConceptDraw Solution Park to design your own workflow diagrams, process flow diagram and flow charts. Need to use Process Flow Diagram for designing Warehouse packages flow.

Symboles Organigramme

Voir aussi d'autres symboles organigramme: Symboles ordinogramme standard, symboles du flux de travail, Vérification Les symboles du schéma fonctionnel, sOrganigramme comptables des symboles, Organigramme de vente des symboles, Symboles pour organigramme des RH, Carte des symboles de processus, Diagramme de processus opérationnels, Symboles utilisés dans le schéma IDEF0.
- Iso 9001 Business Process Mapping
- Iso Process Mapping Example
- Iso Process Mapping
- Sales Flowcharts | Fishbone Diagrams | Iso 9001 Sales Process Chart
- Iso 9001 Process Flowchart Examples
- Process Flowchart | Quality Control Chart Software — ISO ...
- Audit Flowcharts | Iso Process Flow Chart Template
- Process Flowchart | TQM Software — Build Professional TQM ...
- TQM Diagram Example | Process Flowchart | Quality Control Chart ...
- Process Flowchart | Business Process Mapping — How to Map a ...
- ERD | Entity Relationship Diagrams, ERD Software for Mac and Win
- Flowchart | Basic Flowchart Symbols and Meaning
- Flowchart | Flowchart Design - Symbols, Shapes, Stencils and Icons
- Flowchart | Flow Chart Symbols
- Electrical | Electrical Drawing - Wiring and Circuits Schematics
- Flowchart | Common Flowchart Symbols
- Flowchart | Common Flowchart Symbols