Examples of Flowcharts, Org Charts and More


 Sales Flowcharts
The Sales Flowcharts solution lets you create and display sales process maps, sales process workflows, sales steps, the sales process, and anything else involving sales process management.
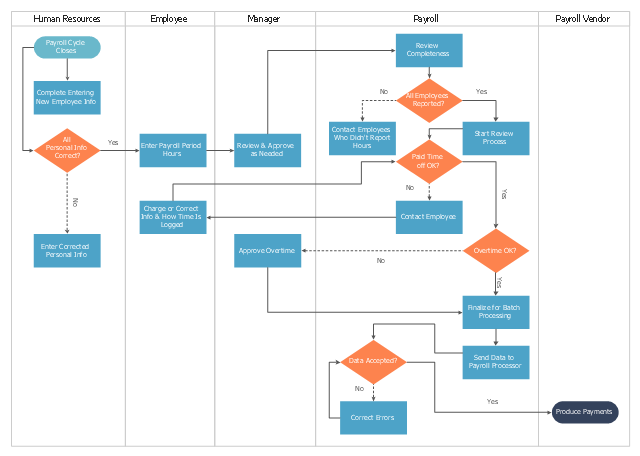
This cross-functional flowchart sample represents the payroll process mapping.
"Business process mapping refers to activities involved in defining what a business entity does, who is responsible, to what standard a business process should be completed, and how the success of a business process can be determined.
The main purpose behind business process mapping is to assist organizations in becoming more efficient. A clear and detailed business process map or diagram allows outside firms to come in and look at whether or not improvements can be made to the current process.
Business process mapping takes a specific objective and helps to measure and compare that objective alongside the entire organization's objectives to make sure that all processes are aligned with the company's values and capabilities.
ISO 9001 requires a business entity to follow a process approach when managing its business, and to this end creating business process maps will assist. The entity can then work towards ensuring its processes are effective (the right process is followed the first time), and efficient (continually improved to ensure processes use the smallest amount of resources)." [Business process mapping. Wikipedia]
The business process map example "Swim lane diagram - Payroll process mapping" was drawn using the ConceptDraw PRO diagramming and vector drawing software extended with the Cross-Functional Flowcharts solution from the Business Processes area of ConceptDraw Solution Park.
Cross-functional flowchart
Fishbone Diagram Example

Fishbone Diagrams solution included to ConceptDraw Solution Park contains powerful drawing tools and a lot of examples, samples and templates. Each Fishbone diagram example is carefully thought-out by experts and is perfect source of inspiration for you.
Draw Fishbone Diagram on MAC Software

Professional diagramming ConceptDraw DIAGRAM MAC OSX software with Fishbone Diagrams solution helps you make cause and effect analysis, identify the possible causes for an effect for problem solving, draw Fishbone diagram on Mac software aka Ishikawa diagram from brainstorm, templates and examples.
How to Construct a Fishbone Diagram

How to Construct a Fishbone Diagram? Construction a Fishbone diagram in professional diagramming software ConceptDraw DIAGRAM is more easy than you think. Just use the predesigned vector elements from the Fishbone Diagrams library for Fishbone Diagrams solution or one of plenty Fishbone templates and examples, and you will get a Cause and Effect diagram in minutes.
Cause and Effect Diagrams

ConceptDraw DIAGRAM powerful diagramming and vector drawing software provides the Fishbone Diagrams solution from the Management area of ConceptDraw Solution Park that allows to design the Cause and Effect Diagrams quick, easy and effective.
 Fishbone Diagrams
The Fishbone Diagrams solution extends ConceptDraw DIAGRAM software with the ability to easily draw the Fishbone Diagrams (Ishikawa Diagrams) to clearly see the cause and effect analysis and also problem solving. The vector graphic diagrams produced using this solution can be used in whitepapers, presentations, datasheets, posters, and published technical material.
 House of Quality
House of Quality solution provides the powerful drawing tools, numerous specific samples and examples, and set of vector design elements of House of Quality shapes and symbols, which will help you in application the Quality function deployment (QFD) methodology and in easy creation the House of Quality Matrices intended for satisfaction the consumers' desires and requirements, for representing them in a visual way and then transformation into the targets and technical requirements to be followed for development the best products.
Fishbone Diagram Design Element
.png)
ConceptDraw DIAGRAM software gives ability to design Fishbone diagrams that identify many possible causes for an effect for problem. Each Fishbone diagram design element included to Fishbone Diagrams library is vector and ready-to-use.
- Audit Flowcharts | Iso Process Flow Chart Template
- Iso 9001 Process Flowchart Examples
- Audit Flowcharts | Flow Chart Iso
- Sales Flowcharts | Fishbone Diagrams | Iso 9001 Sales Process Chart
- Business Process Flow Diagram Iso 9001 Manufacturing
- Iso 9001
- Iso 9001 Swim Lanes
- Swim Lane Diagrams | Swim Lane Flowchart Symbols | Cross ...
- Iso Process Mapping Example
- Payroll Process Flow Chart
- ERD | Entity Relationship Diagrams, ERD Software for Mac and Win
- Flowchart | Basic Flowchart Symbols and Meaning
- Flowchart | Flowchart Design - Symbols, Shapes, Stencils and Icons
- Flowchart | Flow Chart Symbols
- Electrical | Electrical Drawing - Wiring and Circuits Schematics
- Flowchart | Common Flowchart Symbols
- Flowchart | Common Flowchart Symbols