HelpDesk
How to Create a Fishbone (Ishikawa) Diagram Quickly

"Causes in the diagram are often categorized, such as to the 6 M's ...
The 6 Ms (used in manufacturing industry):
(1) Machine (technology);
(2) Method (process);
(3) Material (Includes Raw Material, Consumables and Information.);
(4) Man Power (physical work)/ Mind Power (brain work): Kaizens, Suggestions;
(5) Measurement (Inspection);
(6) Milieu/ Mother Nature (Environment).
The original 6Ms used by the Toyota Production System have been expanded by some to include the following and are referred to as the 8Ms. However, this is not globally recognized. It has been suggested to return to the roots of the tools and to keep the teaching simple while recognizing the original intent; most programs do not address the 8Ms.
(7) Management/ Money Power;
(8) Maintenance." [Ishikawa diagram. Wikipedia]
This 8Ms Ishikawa diagram (manufacturing cause and effect diagram) template is included in the Fishbone Diagram solution from the Management area of ConceptDraw Solution Park.
8Ms Ishikawa diagram

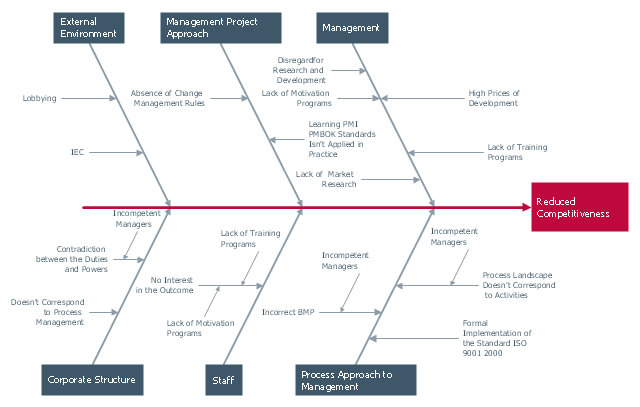
"Cause-and-effect diagrams can reveal key relationships among various variables, and the possible causes provide additional insight into process behavior.
Causes can be derived from brainstorming sessions. These groups can then be labeled as categories of the fishbone. They will typically be one of the traditional categories mentioned above but may be something unique to the application in a specific case. Causes can be traced back to root causes with the 5 Whys technique." [Ishikawa diagram. Wikipedia]
The Ishikawa diagram (cause and effect diagram, fishbone diagram) example "Factors reducing competitiveness" was created using the ConceptDraw PRO diagramming and vector drawing software extended with the Fishbone Diagrams solution from the Management area of ConceptDraw Solution Park.
Ishikawa diagram
HelpDesk
How to Draw a Fishbone Diagram with ConceptDraw PRO

 Fishbone Diagrams
The Fishbone Diagrams solution extends ConceptDraw PRO v10 software with the ability to easily draw the Fishbone Diagrams (Ishikawa Diagrams) to clearly see the cause and effect analysis and also problem solving. The vector graphic diagrams produced using this solution can be used in whitepapers, presentations, datasheets, posters, and published technical material.
"Causes in the diagram are often categorized, such as to the 6 M's ...
The 6 Ms (used in manufacturing industry)
- Machine (technology)
- Method (process)
- Material (Includes Raw Material, Consumables and Information.)
- Man Power (physical work)/ Mind Power (brain work): Kaizens, Suggestions
- Measurement (Inspection)
- Milieu/ Mother Nature (Environment)
The original 6Ms used by the Toyota Production System have been expanded by some to include the following and are referred to as the 8Ms. However, this is not globally recognized. It has been suggested to return to the roots of the tools and to keep the teaching simple while recognizing the original intent; most programs do not address the 8Ms.
- Management/ Money Power
- Maintenance" [Ishikawa diagram. Wikipedia]
The 4Ms fishbone diagram (cause and effect diagram, Ishikawa diagram) example "Production process" was created using the ConceptDraw PRO diagramming and vector drawing software extended with the Fishbone Diagrams solution from the Management area of ConceptDraw Solution Park.
4Ms Ishikawa diagram

"Ishikawa diagrams (also called fishbone diagrams, herringbone diagrams, cause-and-effect diagrams, or Fishikawa) are causal diagrams created by Kaoru Ishikawa (1968) that show the causes of a specific event. Common uses of the Ishikawa diagram are product design and quality defect prevention, to identify potential factors causing an overall effect. Each cause or reason for imperfection is a source of variation. Causes are usually grouped into major categories to identify these sources of variation. The categories typically include:
- People: Anyone involved with the process
- Methods: How the process is performed and the specific requirements for doing it, such as policies, procedures, rules, regulations and laws
- Machines: Any equipment, computers, tools, etc. required to accomplish the job
- Materials: Raw materials, parts, pens, paper, etc. used to produce the final product
- Measurements: Data generated from the process that are used to evaluate its quality
- Environment: The conditions, such as location, time, temperature, and culture in which the process operates" [Ishikawa diagram. Wikipedia]
The fishbone diagram example "Causes of low-quality output" was created using the ConceptDraw PRO diagramming and vector drawing software extended with the Fishbone Diagrams solution from the Management area of ConceptDraw Solution Park.
Ishikawa diagram

- Ishikawa Diagram | Using Fishbone Diagrams for Problem Solving ...
- Fishbone Diagrams | Ishikawa Diagram | Using Fishbone Diagrams ...
- Ishikawa Diagram | Fishbone Diagram Template | Manufacturing 8 ...
- Ishikawa Diagram | Manufacturing 8 Ms fishbone diagram ...
- Fishbone Diagram Problem Solving | Using Fishbone Diagrams for ...
- Ishikawa Diagram Examples Education
- Ishikawa Diagram | Fishbone Diagram Example | Ishikawa fishbone ...
- Ishikawa Diagram | Draw Fishbone Diagram on MAC Software ...
- 4 Ms fishbone diagram - Production process | Ishikawa Diagram ...
- Design elements - Fishbone diagram | Ishikawa Diagram | Using ...
- How to Create a Fishbone ( Ishikawa) Diagram Quickly | How to ...
- Ishikawa diagram - Factors reducing competitiveness | Ishikawa ...
- Ishikawa Diagram Problem Computer
- Kaoru Ishikawa Diagram Tqm
- Fishbone Diagrams | Fishbone Diagram | How to Create a Fishbone ...
- Ishikawa diagram
- Total Quality Management Value | Ishikawa Diagram | Cause and ...
- Ishikawa Diagram Transport
- How to Create a Fishbone ( Ishikawa) Diagram Quickly | Fishbone ...
- How to Create a Fishbone ( Ishikawa) Diagram Quickly | Draw ...
- ERD | Entity Relationship Diagrams, ERD Software for Mac and Win
- Flowchart | Basic Flowchart Symbols and Meaning
- Flowchart | Flowchart Design - Symbols, Shapes, Stencils and Icons
- Flowchart | Flow Chart Symbols
- Electrical | Electrical Drawing - Wiring and Circuits Schematics
- Flowchart | Common Flowchart Symbols
- Flowchart | Common Flowchart Symbols