Bar Diagrams for Problem Solving. Create economics and financial bar charts with Bar Graphs Solution

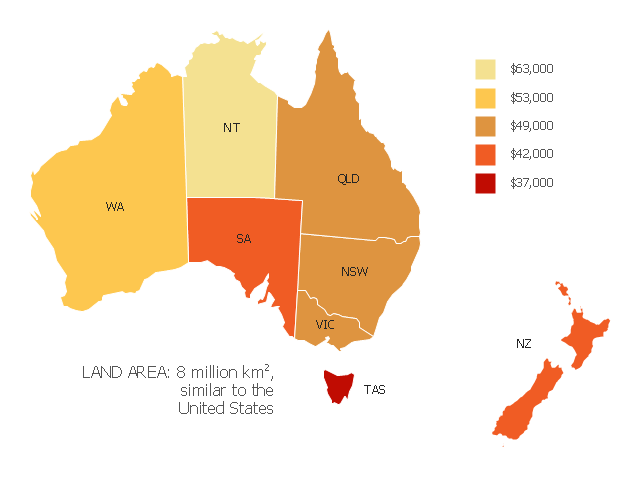
"Household income is a measure of the combined incomes of all people sharing a particular household or place of residence. It includes every form of income, e.g., salaries and wages, retirement income, near cash government transfers like food stamps, and investment gains.
Average household income can be used as an indicator for the monetary well-being of a country's citizens. Mean or median net household income, after taxes and mandatory contributions, are good indicators of standard of living, because they include only disposable income and acknowledge people sharing accommodation benefit from pooling at least some of their living costs.
Average household incomes need not map directly to measures of an individual's earnings such as per capita income as numbers of people sharing households and numbers of income earners per household can vary significantly between regions and over time." [Household income. Wikipedia]
This map example shows 2007 median household incomes in the states and mainland territories of the Commonwealth of Australia.
The thematic map example "Map of median household income in Australia" was redesigned from the Wikimedia Commons file: Map of median household income in Australia.PNG.
[commons.wikimedia.org/ wiki/ File:Map_ of_ median_ household_ income_ in_ Australia.PNG]
The example "Map of median household income in Australia" was created using the ConceptDraw PRO diagramming and vector drawing software extended with the Continent Map solution from the Maps area of ConceptDraw Solution Park.
Thematic map - Australia
Venn Diagram Examples for Problem Solving. Environmental Social Science. Human Sustainability Confluence

Create your Venn diagrams for problem solving in environmental social science using the ConceptDraw PRO diagramming and vector drawing software extended with the Venn Diagrams solution from the area "What is a Diagram" of ConceptDraw Solution Park.
Wireless Network Mode

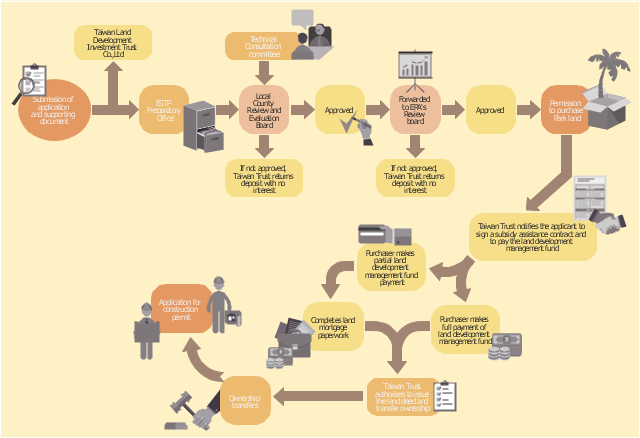
This example of business infographics was designed on the base of flowchart in the webpage "Establishing Operations in an Environmental Protection Park" from the website of Taiwan Department of Investment Services, Ministry of Economic Affairs.
"Upon registration of the company, the "Guideline for Operation and Management of Environmental Science and Technology Park Promotion Program" and "Guideline for Execution of Subsidies for Environmental Science and Technology Park Promotion Program" shall be followed for applying for admission to the Park. Any foreigner who wishes to invest in and build a factory in the Park shall apply to the local Preparatory Office of ESTP for admission approval. It will take approximately two months to secure such approval from the application submission date. The investment and construction application procedures prescribed by preparatory Office of ESTP in Southern Taiwan are shown below for reference." [investtaiwan.nat.gov.tw/ eng/ show.jsp?ID=123&MID=2]
The infographics example "Investment and construction application procedures" was created using the ConceptDraw PRO diagramming and vector drawing software extended with the HR Flowcharts solution from the Management area of ConceptDraw Solution Park.
Flowchart infographics
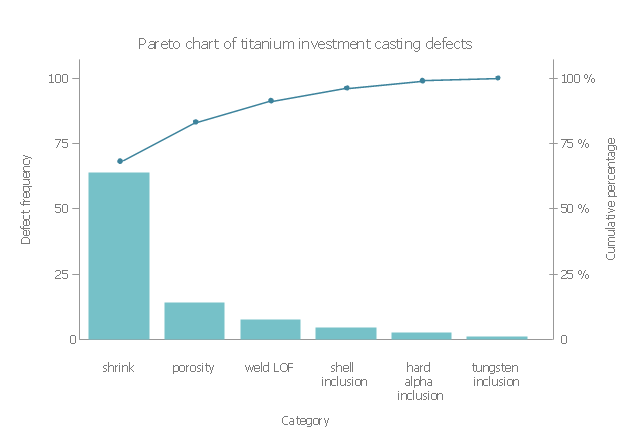
This example was redesigned from the Wikimedia Commons file: Pareto chart of titanium investment casting defects.svg.
[commons.wikimedia.org/ wiki/ File:Pareto_ chart_ of_ titanium_ investment_ casting_ defects.svg]
This file is licensed under the Creative Commons Attribution-Share Alike 3.0 Unported license. [creativecommons.org/ licenses/ by-sa/ 3.0/ deed.en]
"A Pareto chart, named after Vilfredo Pareto, is a type of chart that contains both bars and a line graph, where individual values are represented in descending order by bars, and the cumulative total is represented by the line.
The left vertical axis is the frequency of occurrence, but it can alternatively represent cost or another important unit of measure. The right vertical axis is the cumulative percentage of the total number of occurrences, total cost, or total of the particular unit of measure. Because the reasons are in decreasing order, the cumulative function is a concave function. ...
The Pareto chart is one of the seven basic tools of quality control." [Pareto chart. Wikipedia]
The Pareto chart example "Titanium investment casting defects" was created using the ConceptDraw PRO software extended with the Seven Basic Tools of Quality solution from the Quality area of ConceptDraw Solution Park.
Pareto chart example
Pareto Chart

The vector stencils library "Management pictograms" contains 72 management pictograms.
Use it to create your management infogram in the ConceptDraw PRO diagramming and vector drawing software.
The flat icons example "Management pictograms - Vector stencils library" is included in the solution "Marketing infographics" from the "Business infographics" area of ConceptDraw Solution Park.
Use it to create your management infogram in the ConceptDraw PRO diagramming and vector drawing software.
The flat icons example "Management pictograms - Vector stencils library" is included in the solution "Marketing infographics" from the "Business infographics" area of ConceptDraw Solution Park.
Accounting management

Activity

Audit management

Board of directors

Budget

Business managemen

Business management tools

Business model

Commanding

Communication

Company

Contract management

Controlling

Coordinating

Core competencies

Corporate strategy

Creativity

Crisis management

Crisis management 2

Decision making

Environmental management

Expenses

External environment

Financial management

Financial management 2

Financial planning

First-level manager

Goal

HR management

Investment management

IT management

Knowledge management

Knowledge management 2

Leadership

Macro environment

Management system

Managerial accounting

Manufacturing management

Market orientation

Marketing management

Marketing strategy

Middle-level manager

Mission

Objectives

Operations management

Organizing

Performance

Performance management

Planning

Policy

PR management

Problem solving

Process management

Product management

Profit

Profit 2

Project management

Quality management

Research and development

Resource management

Resources

Risk management

Sales manegment

Service management

Stakeholder management

Strategic management

Strategic planning

Technology management

Time frame

Time management

Top-level manager

Vision

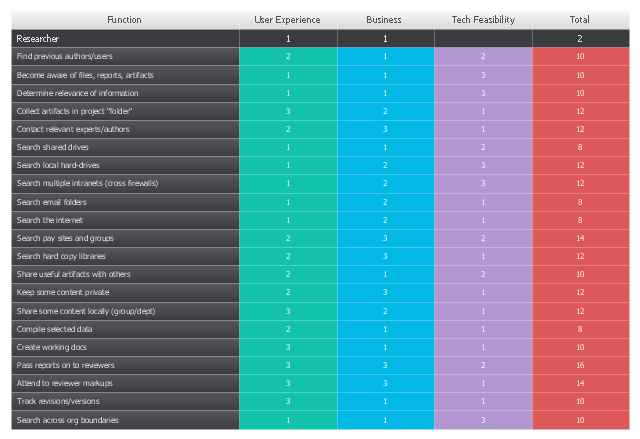
"Prioritization Matrix ... tool is used to prioritize items and describe them in terms of weighted criteria. It uses a combination of tree and matrix diagramming techniques to do a pair-wise evaluation of items and to narrow down options to the most desired or most effective. Popular applications for the Prioritization Matrix include Return-on-Investment (ROI) or Cost-Benefit analysis (Investment vs. Return), Time management Matrix (Urgency vs. Importance), etc." [Seven Management and Planning Tools. Wikipedia]
The opportunity prioritization matrix example was created using the ConceptDraw PRO diagramming and vector drawing software extended with the solution "Seven Management and Planning Tools" from the Management area of ConceptDraw Solution Park.
The opportunity prioritization matrix example was created using the ConceptDraw PRO diagramming and vector drawing software extended with the solution "Seven Management and Planning Tools" from the Management area of ConceptDraw Solution Park.
Prioritization matrix
 Seven Basic Tools of Quality
Manage quality control in the workplace, using fishbone diagrams, flowcharts, Pareto charts and histograms, provided by the Seven Basic Tools of Quality solution.
Rainfall Bar Chart

This sample was created in ConceptDraw PRO diagramming and vector drawing software using the Bar Graphs Solution from the Graphs and Charts area of ConceptDraw Solution Park.
Relative Value Chart Software

Relative values are widely used in:business, economics, investment, management, marketing, statistics, etc.
ConceptDraw PRO software is the best for drawing professional looking Relative Value Charts. ConceptDraw PRO provides Divided Bar Diagrams solution from the Graphs and Charts Area of ConceptDraw Solution Park.
Introduction to Cloud Computing Architecture

Management - Design Elements

You can create and view impact analysis drawings from specific design elements to examine the tasks.
Prioritization Matrix

- Investment Png
- Investment Vector Png
- Investment Png Vector
- Investment Logo Png Vector
- Pareto chart of titanium investment casting defects | HR professions ...
- Investment Team Icon Png
- Like Vector Png
- Stakeholder Flat Icon Png
- Core Competency Png
- Management Stakeholders Blue Png
- Knowledge Management Png
- Asset Management Icons Vector Png
- Financial Vector Png
- Financial Management Png
- Development Operations Flat Png Images
- Operations Management Png
- Research And Development Icon Png
- Management Vector Icon Png
- Stakeholder Management Icon Png
- Accountancy Business Management Clip Art Png
- ERD | Entity Relationship Diagrams, ERD Software for Mac and Win
- Flowchart | Basic Flowchart Symbols and Meaning
- Flowchart | Flowchart Design - Symbols, Shapes, Stencils and Icons
- Flowchart | Flow Chart Symbols
- Electrical | Electrical Drawing - Wiring and Circuits Schematics
- Flowchart | Common Flowchart Symbols
- Flowchart | Common Flowchart Symbols