Workflow to Make a Purchase. Accounting Flowchart Example

Flowchart of Products. Flowchart Examples

A Flowchart is a graphically representation of the process that step-by-step lead to the solution the problem. The geometric figures on the Flowchart represent the steps of the process and are connected with arrows that show the sequence of the actions. The Flowcharts are widely used in engineering, architecture, science, analytics, government, politics, business, marketing, manufacturing, administration, etc.
Work Flow Process Chart

This example was designed on the base of the workflow diagram from the North Carolina Office of the State Controller website. [osc.nc.gov/ sigdocs/ sig_ docs/ documentation/ policies_ procedures/ flow.html]
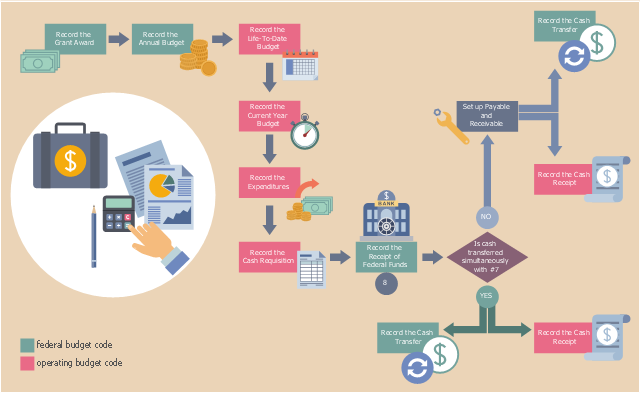
"Grants are non-repayable funds or products disbursed by one party (grant makers), often a government department, corporation, foundation or trust, to a recipient, often (but not always) a nonprofit entity, educational institution, business or an individual. In order to receive a grant, some form of "Grant Writing" often referred to as either a proposal or an application is required. ...
Most grants are made to fund a specific project and require some level of compliance and reporting. The grant writing process involves an applicant submitting a proposal (or submission) to a potential funder, either on the applicant's own initiative or in response to a Request for Proposal from the funder. Other grants can be given to individuals, such as victims of natural disasters or individuals who seek to open a small business. Sometimes grant makers require grant seekers to have some form of tax-exempt status, be a registered nonprofit organization or a local government. ...
Project-related funding involving business, communities, and individuals is often arranged by application either in writing or online." [Grant (money). Wikipedia]
The workflow diagram example "Grant Accounting: business process flow" was created using ConceptDraw PRO software extended with the Business Process Workflow Diagrams solution from the Business Processes area of ConceptDraw Solution Park.
Workflow diagram
Purchasing Flow Chart. Purchasing Flowchart Example

Business Process Modeling Notation Template
 B2B process diagram BPMN 2.0 - Cab booking process")
Software Work Flow Process in Project Management with Diagram

This sample shows the Workflow Diagram that clearly illustrates stages a BPM consists of and relations between all parts of business. The Workflow Diagrams are used to represent the transferring of data during the work process, to study and analysis the working processes, and to optimize a workflow.
Types of Flowcharts


 Business Process Workflow Diagrams
The Business Process Workflow Diagrams solution enhances the ConceptDraw PRO v10 functionality with predesigned examples, samples and a numerous collection of predesigned vector objects of workflow chart elements, icons, arrows, connectors, and varied wor
Relative Value Chart Software

Relative values are widely used in:business, economics, investment, management, marketing, statistics, etc.
ConceptDraw PRO software is the best for drawing professional looking Relative Value Charts. ConceptDraw PRO provides Divided Bar Diagrams solution from the Graphs and Charts Area of ConceptDraw Solution Park.
Business Diagram Software


Bar Diagrams for Problem Solving. Create event management bar charts with Bar Graphs Solution

Workflow Diagram Data

ConceptDraw PRO is a workflow diagram software contains specific features help you to draw diagrams faster, such as RapidDraw, or Arrows10. There is also a rich set of samples and templates to give you an example of data may be visualized as workflow diagram.
Drawing Workflow Diagrams

Business Process Workflow Diagram

The workflows on the Business Process Workflow Diagram are represented using the set of common symbols which let easy illustrate business processes and process flows, depict the start, all major steps and end of the process, what data are used by the process, how the data flow through the business areas within scope of our project, how the tasks are executed and by who, and how workers interact with each other.

- Financial Flow Chart Examples
- Process Flowchart | Design elements - Workflow finance | Basic ...
- Investment Banking Process Flow Chart
- Accounting Recording Process Flow
- Process Flowchart | Investment and construction application ...
- Process Flowchart | Audit Procedures | Basic Flowchart Symbols ...
- Investment Budget Workflow
- Steps of Accounting Cycle | How to Make an Accounting Process ...
- Data Flow Diagram Process | Data Flow Diagram (DFD) | Account ...
- Return Flow Chart
- Process Flowchart | Design elements - Workflow finance | Types of ...
- Process Flowchart | Design elements - Workflow finance | Business ...
- Basic Flowchart Images. Flowchart Examples | Basic Flowchart ...
- Process Flow Chart For Recording
- Clipart Accounting
- Flowchart Examples and Templates | Accounting Flowchart Symbols ...
- Process Flowchart | Basic Flowchart Symbols and Meaning | Audit ...
- Process Flow Of Opening Accounting Firm
- Financial Comparison Chart | Bar Diagrams for Problem Solving ...
- Local area network (LAN). Computer and Network Examples ...
- ERD | Entity Relationship Diagrams, ERD Software for Mac and Win
- Flowchart | Basic Flowchart Symbols and Meaning
- Flowchart | Flowchart Design - Symbols, Shapes, Stencils and Icons
- Flowchart | Flow Chart Symbols
- Electrical | Electrical Drawing - Wiring and Circuits Schematics
- Flowchart | Common Flowchart Symbols
- Flowchart | Common Flowchart Symbols