Pyramid Diagram

3D triangular diagram of DIKW pyramid has 6 levels: measurement, facts, data, information, knowledge, wisdom.
The data component include different scattered signs or symbols which are merely useless until these random objective facts are somehow processed. Data is a resource which has to be manipulated or rearranged to get useful. Information can be extracted from a pile of data, it also can be mined from different data storages.
The vector stencils library "Business people" contains 36 businessperson icons.
Use it to design your business and finance illustrations and infographics with ConceptDraw PRO diagramming and vector drawing software.
"A businessperson is someone involved in business, where in particular undertaking of activities, commercial or industrial, for the purpose of generating cash flow, sales, and revenue utilizing a combination of human, financial, intellectual and physical capital that further fuels economic development anilnd growth." [Businessperson. Wikipedia]
The businessperson icon set example "Design elements - Business people" is included in the Business and Finance solution from Illustration area of ConceptDraw Solution Park.
Icon set
IDEF1 standard

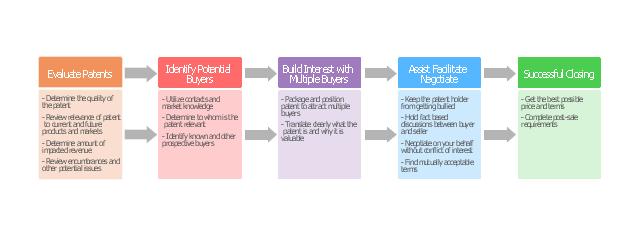
"A patent ... is a set of exclusive rights granted by a sovereign state to an inventor or assignee for a limited period of time in exchange for detailed public disclosure of an invention. An invention is a solution to a specific technological problem and is a product or a process. Patents are a form of intellectual property.
The procedure for granting patents, requirements placed on the patentee, and the extent of the exclusive rights vary widely between countries according to national laws and international agreements. Typically, however, a granted patent application must include one or more claims that define the invention. A patent may include many claims, each of which defines a specific property right. These claims must meet relevant patentability requirements, such as novelty and non-obviousness. The exclusive right granted to a patentee in most countries is the right to prevent others from making, using, selling, importing, or distributing a patented invention without permission.
Under the World Trade Organization's (WTO) Agreement on Trade-Related Aspects of Intellectual Property Rights, patents should be available in WTO member states for any invention, in all fields of technology, and the term of protection available should be a minimum of twenty years. Nevertheless, there are variations on what is patentable subject matter from country to country." [Patent. Wikipedia]
The step chart example "Selling technology patent process" was created using the ConceptDraw PRO diagramming and vector drawing software extended with the Block Diagrams solution from the area "What is a Diagram" of ConceptDraw Solution Park.
Step chart
This circle-spoke diagram sample shows how leadership and data provide essential coordination of other functions in an asset management environment. Leadership points the way and common data systems keep all divisions communicating effectively.
This circle-spoke diagram example was created on the base of illustration of article "Beyond the Short Term: Transportation Asset Management for Long-Term Sustainability, Accountability and Performance" from the website of The Federal Highway Administration (FHWA).
[fhwa.dot.gov/ asset/ 10009/ tam_ topr806_ 3.cfm]
"Asset management, broadly defined, refers to any system that monitors and maintains things of value to an entity or group. It may apply to both tangible assets such as buildings and to intangible concepts such as intellectual property and goodwill. Asset management is a systematic process of operating, maintaining, upgrading, and disposing of assets cost-effectively. Alternative views of asset management in the engineering environment are: the practice of managing assets to achieve the greatest return (particularly useful for productive assets such as plant and equipment), and the process of monitoring and maintaining facilities systems, with the objective of providing the best possible service to users (appropriate for public infrastructure assets)." [Asset management. Wikipedia]
The hub-and-spoke diagram example "Leadership and data" was created using the ConceptDraw PRO diagramming and vector drawing software extended with the Circle-Spoke Diagrams solution from the area "What is a Diagram" of ConceptDraw Solution Park.
Circle-spoke diagram

- Design elements - Business people | Business people - Vector ...
- Business People Vector Png
- Leader Vector Png
- Team Work Vector Png
- Economic Growth Icon Vector Png
- Business People It Icon Png
- Presentation design elements - Vector clipart library | Design ...
- HR workflow - Vector stencils library | HR steps - Vector stencils ...
- Contract Illustration Png
- Business people pictograms - Vector stencils library | Process ...
- Vacancy Vector Icon Png
- Business Development Icon Png
- Contract Icon Vector Png
- People Work Vector Png
- Human Capitl Vector Icon Png
- Design elements - Business people | 25 Typical Orgcharts ...
- People Elements Png
- Business People Logo Png
- People Icons Illustration Clipart Vector Png
- Business people - Vector stencils library | Design elements ...
- ERD | Entity Relationship Diagrams, ERD Software for Mac and Win
- Flowchart | Basic Flowchart Symbols and Meaning
- Flowchart | Flowchart Design - Symbols, Shapes, Stencils and Icons
- Flowchart | Flow Chart Symbols
- Electrical | Electrical Drawing - Wiring and Circuits Schematics
- Flowchart | Common Flowchart Symbols
- Flowchart | Common Flowchart Symbols