HelpDesk
Event-driven Process Chain (EPC) Diagram Software

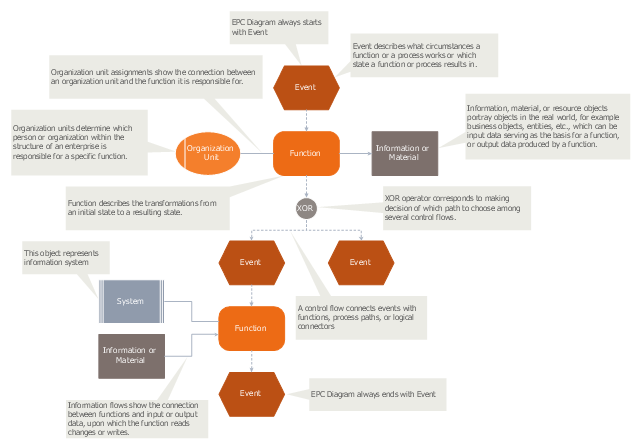
An EPC diagram shows different business processes through various workflows. The workflows are seen as functions and events that are connected by different teams or people, as well as tasks that allow business processes to be executed. The best thing about this type of enterprise modelling is that creating an EPC diagram is quick and simple as long as you have the proper tool. One of the main usages of the EPC diagrams is in the modelling, analyzing and re-engineering of business processes. With the use of the flowchart, businesses are able to see inefficiencies in the processes and modify to make them more productive. Event-driven process chain diagrams are also used to configure an enterprise resource pla
 IDEF0 Diagrams
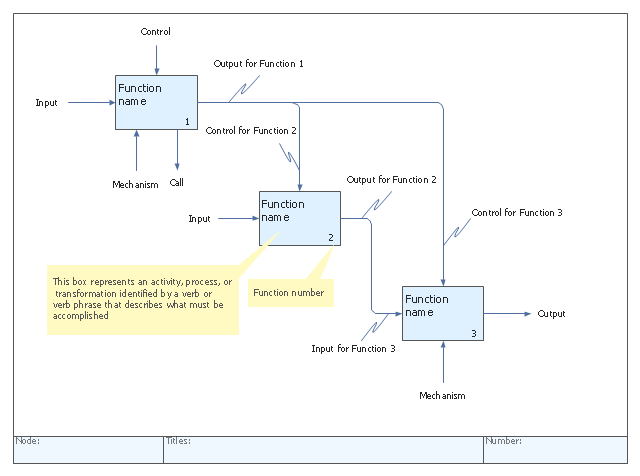
IDEF0 Diagrams visualize system models using the Integration Definition for Function Modeling (IDEF) methodology. Use them for analysis, development and integration of information and software systems, and business process modelling.
"An Event-driven Process Chain (EPC) is a type of flowchart used for business process modelling. Event-driven Process Chains can be used for configuring an enterprise resource planning (ERP) implementation, and for business process improvement. ...
Businesses use Event-driven Process Chain diagrams to lay out business process work flows, originally in conjunction with SAP R/ 3 modeling, but now more widely. It is used by many companies for modeling, analyzing, and redesigning business processes. The Event-driven Process Chain method was developed within the framework of Architecture of Integrated Information Systems (ARIS). As such it forms the core technique for modeling in ARIS, which serves to link the different views in the so-called control view." [Event-driven process chain. Wikipedia]
The event-driven process chain (EPC) diagram template for the ConceptDraw PRO diagramming and vector drawing software is included in the Event-driven Process Chain Diagrams solution from the Business Processes area of ConceptDraw Solution Park.
EPC diagram template
HelpDesk
How to Create a Data Flow Diagram using ConceptDraw PRO
 example")
"IDEF0, a compound acronym (Icam DEFinition for Function Modeling, where 'ICAM' is an acronym for Integrated Computer Aided Manufacturing) is a function modeling methodology for describing manufacturing functions, which offers a functional modeling language for the analysis, development, reengineering, and integration of information systems; business processes; or software engineering analysis.
IDEF0 is part of the IDEF family of modeling languages in the field of software engineering, and is built on the functional modeling language Structured Analysis and Design Technique (SADT). ...
FIPS PUB 183 "Integration Definition for Function Modeling (IDEF0)," was withdrawn as a Federal Standard (in favor of OPEN Specifications and Standards) September 2, 2008, as cited in "The Federal Register", Volume 73, page 51276 (73FR/ 51276). ...
IDEF0, used to produce a "function model". A function model is a structured representation of the functions, activities or processes within the modeled system or subject area." [IDEF0. Wikipedia]
The template "IDEF0 diagram" is included in the IDEF0 Diagrams solution from the Software Development area of ConceptDraw Solution Park.
IDEF0 template
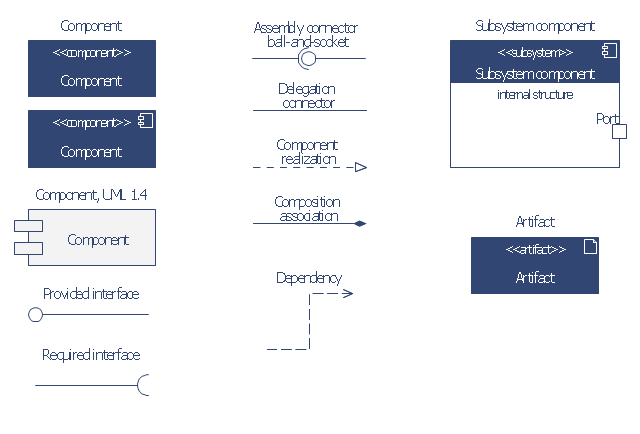
The vector stencils library "Bank UML component diagram" contains 13 shapes for drawing UML component diagrams.
Use it for object-oriented modeling of your bank information system.
"A component is something required to execute a stereotype function. Examples of stereotypes in components include executables, documents, database tables, files, and library files.
Components are wired together by using an assembly connector to connect the required interface of one component with the provided interface of another component. This illustrates the service consumer - service provider relationship between the two components. ...
When using a component diagram to show the internal structure of a component, the provided and required interfaces of the encompassing component can delegate to the corresponding interfaces of the contained components. ...
Symbols.
This may have a visual stereotype in the top right of the rectangle of a small rectangle with two even smaller rectangles jutting out on the left.
The lollipop, a small circle on a stick represents an implemented or provided interface. The socket symbol is a semicircle on a stick that can fit around the lollipop. This socket is a dependency or needed interface." [Component diagram. Wikipedia]
This example of UML component diagram symbols for the ConceptDraw PRO diagramming and vector drawing software is included in the ATM UML Diagrams solution from the Software Development area of ConceptDraw Solution Park.
UML component diagram symbols
 Pyramid Diagrams
Pyramid Diagrams solution extends ConceptDraw PRO software with templates, samples and library of vector stencils for drawing the marketing pyramid diagrams.
- 4 Level pyramid model diagram - Information systems types | 5 Level ...
- Chart Of Management Information System With Diagram
- Function Of Information System With Diagram
- Data Flow Diagram
- Function Model Diagram Template
- Diagramatic Function Of Information System
- Management Information System Block Diagram
- Context Diagram Template | Process Flowchart | Audiovisual system ...
- Function Block Diagram For Information System
- Various Types Of Information System Based On Hierarchy And ...
- Function Of Accounting Information Examples With Diagram
- 4 Level pyramid model diagram - Information systems types ...
- Block Diagram Of Function Organization Management
- IDEF0 diagram template | Business Processes | Cross-Functional ...
- DFD Library System | Data Flow Diagram Symbols. DFD Library ...
- 3 Level pyramid model diagram - Information systems types
- How to Create Flowcharts for an Accounting Information System ...
- Pyramid Diagram | 4 Level pyramid model diagram - Information ...
- Data Flow Diagram (DFD) | DFD - Process of account receivable ...
- Pyramid Diagram | 5 Level pyramid model diagram - Information ...
- ERD | Entity Relationship Diagrams, ERD Software for Mac and Win
- Flowchart | Basic Flowchart Symbols and Meaning
- Flowchart | Flowchart Design - Symbols, Shapes, Stencils and Icons
- Flowchart | Flow Chart Symbols
- Electrical | Electrical Drawing - Wiring and Circuits Schematics
- Flowchart | Common Flowchart Symbols
- Flowchart | Common Flowchart Symbols