Winter Sports Vector Clipart. Medal Map. Spatial Infographics

Winter Sports. Olympic Games Illustrations. Medal Summary
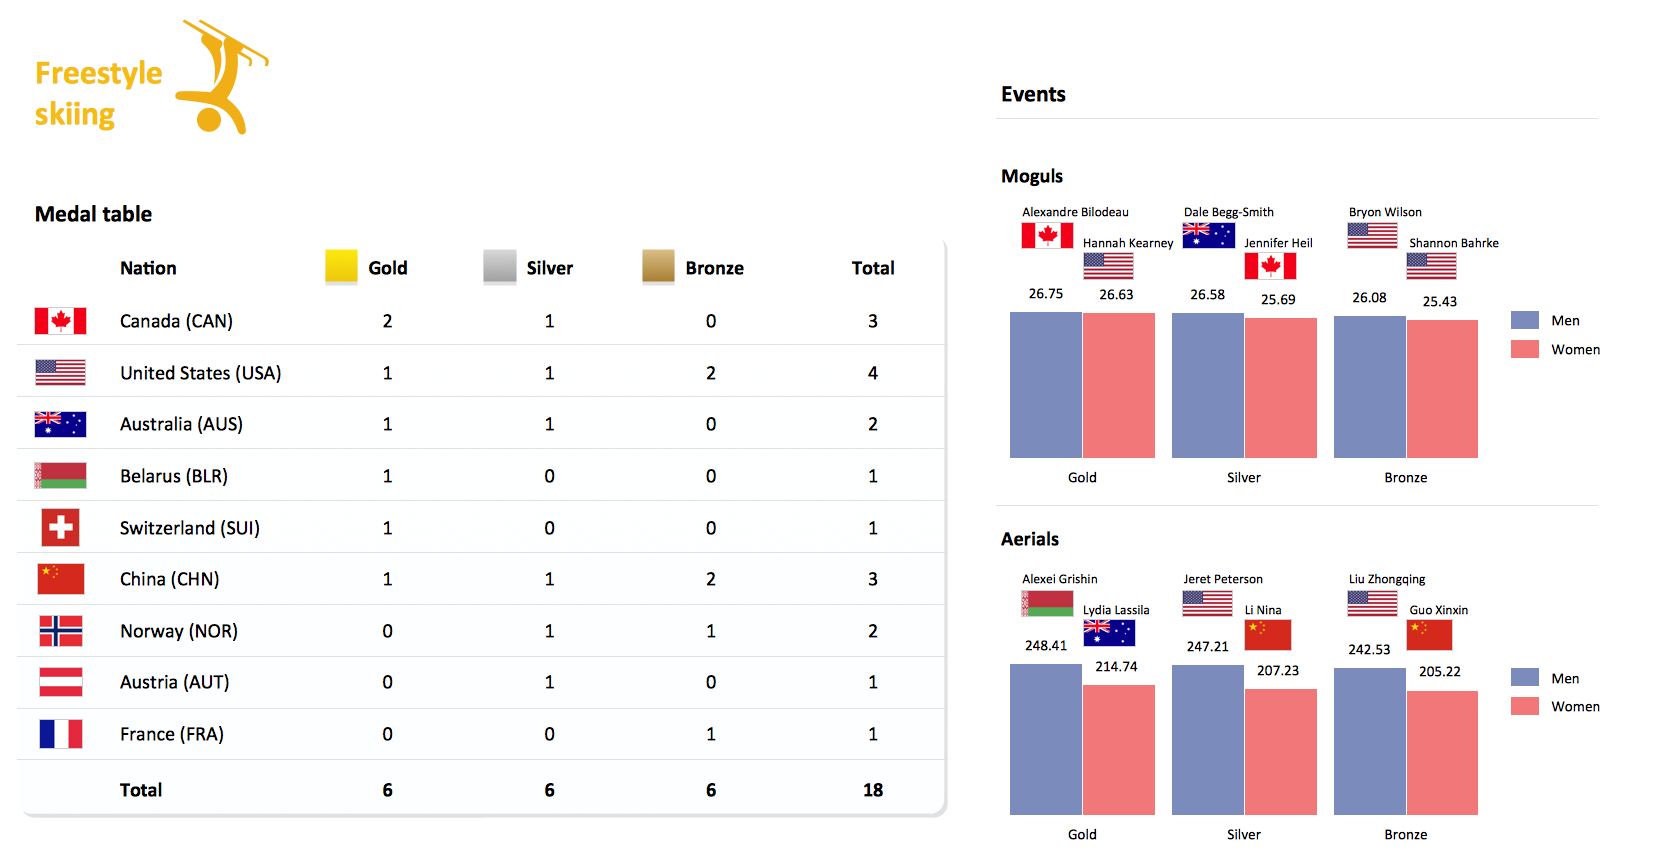
 Winter Sports
The Winter Sports solution from Sport area of ConceptDraw Solution Park contains winter sports illustration examples, templates and vector clipart libraries.
 Sport Area
Solutions from the Sport Area of ConceptDraw Solution Park collect templates, samples and libraries of color scalable vector stencils, icons and clip art for sport illustrations, presentations, infographics, web sites and blogs.
 25 Typical Orgcharts
The 25 Typical Orgcharts solution contains powerful organizational structure and organizational management drawing tools, a variety of professionally designed organization chart and matrix organization structure samples, 25 templates based on various orga
 Area Charts
Area Charts are used to display the cumulative totals over time using numbers or percentages; or to show trends over time among related attributes. The Area Chart is effective when comparing two or more quantities. Each series of data is typically represented with a different color, the use of color transparency in an object’s transparency shows overlapped areas and smaller areas hidden behind larger areas.
 Sport Field Plans
Sport Field Plans solution extends ConceptDraw DIAGRAM with samples, templates and libraries of ready-made design elements for developing layouts of sport fields, recreation areas, playground layouts plans, and for professional drawing various sport field plans — for football, basketball, volleyball, golf, baseball, tennis, etc. Depict all your playground layout ideas easily and decisively implement the playground layout designs. Use the final colorful, strict and accurate ConceptDraw's playground layouts when designing the building documentation, brochures, booklets, advertising materials, sports editions, sport maps, business plans, on web sites of sport complexes, sport centers, hotels, etc.
 Ice Hockey
The Ice Hockey Solution extends the capabilities of ConceptDraw DIAGRAM.5 (or later) with samples, templates, and libraries of vector objects for drawing hockey diagrams, plays schemas, and illustrations. The Ice Hockey Solution can be used to make polishe
 Soccer
The Soccer (Football) Solution extends ConceptDraw DIAGRAM.5 (or later) software with samples, templates, and libraries of vector objects for drawing soccer (football) diagrams, plays schemas, and illustrations. It can be used to make professional looking
Area Charts
Area Charts are used to display the cumulative totals over time using numbers or percentages; or to show trends over time among related attributes. The Area Chart is effective when comparing two or more quantities. Each series of data is typically represented with a different color, the use of color transparency in an object’s transparency shows overlapped areas and smaller areas hidden behind larger areas.
- Winter Sports. Olympic Games Infographics . Medal Table | Winter ...
- Winter Sports. Olympic Games Infographics . Medal Table | Winter ...
- Winter Sports. Olympic Games Illustrations. Medal Summary | Sport ...
- Winter Olympics - Figure skating | Winter Sports Vector Clipart ...
- Flow Chart for Olympic Sports | Winter Sports. Olympic Games ...
- Winter Sports Vector Clipart. Medal Map. Spatial Infographics ...
- Design elements - Composition charts and indicators | Design ...
- Double bar graph - Template | Design elements - Composition ...
- Design elements - Time and clock pictograms | Time and clock ...
- Sport pictograms. Olympic Games | Flow Chart for Olympic Sports ...
- ERD | Entity Relationship Diagrams, ERD Software for Mac and Win
- Flowchart | Basic Flowchart Symbols and Meaning
- Flowchart | Flowchart Design - Symbols, Shapes, Stencils and Icons
- Flowchart | Flow Chart Symbols
- Electrical | Electrical Drawing - Wiring and Circuits Schematics
- Flowchart | Common Flowchart Symbols
- Flowchart | Common Flowchart Symbols