Infographic Maker

Infographic Tools
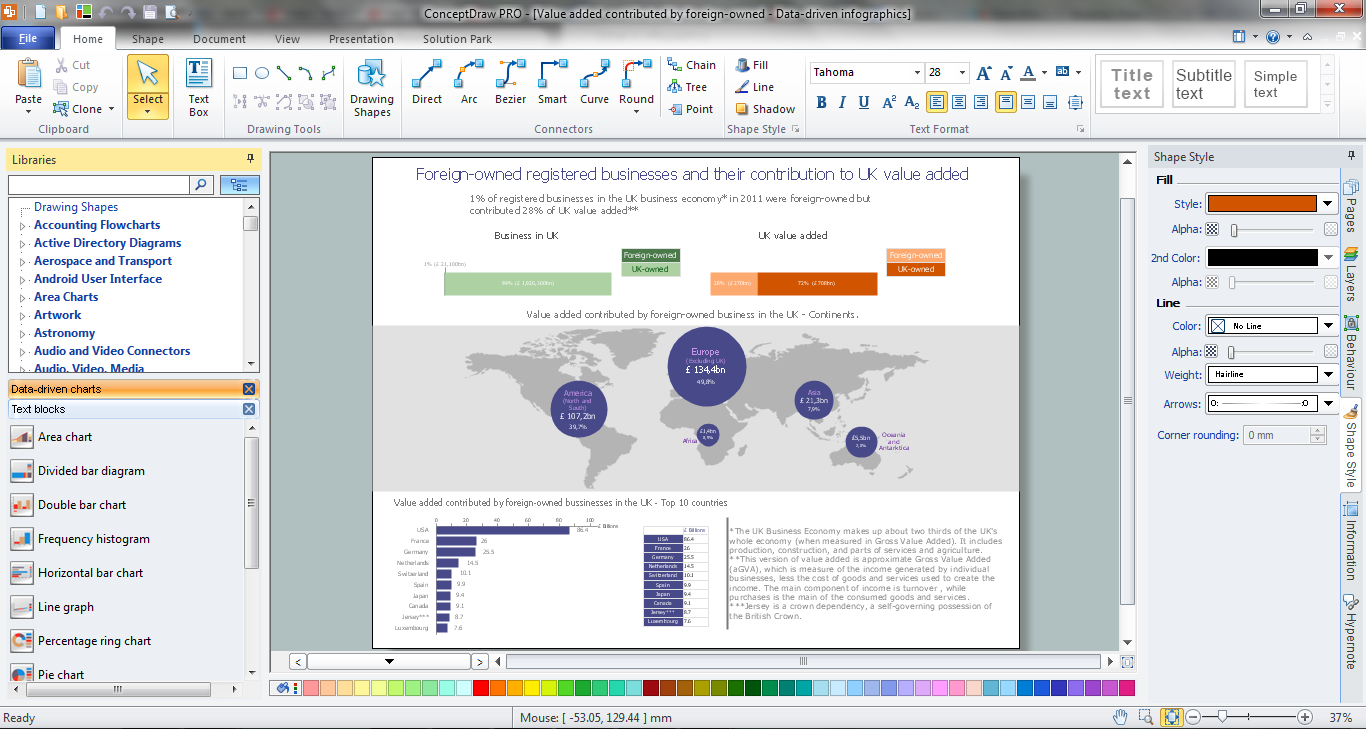
Best Tool for Infographic Construction

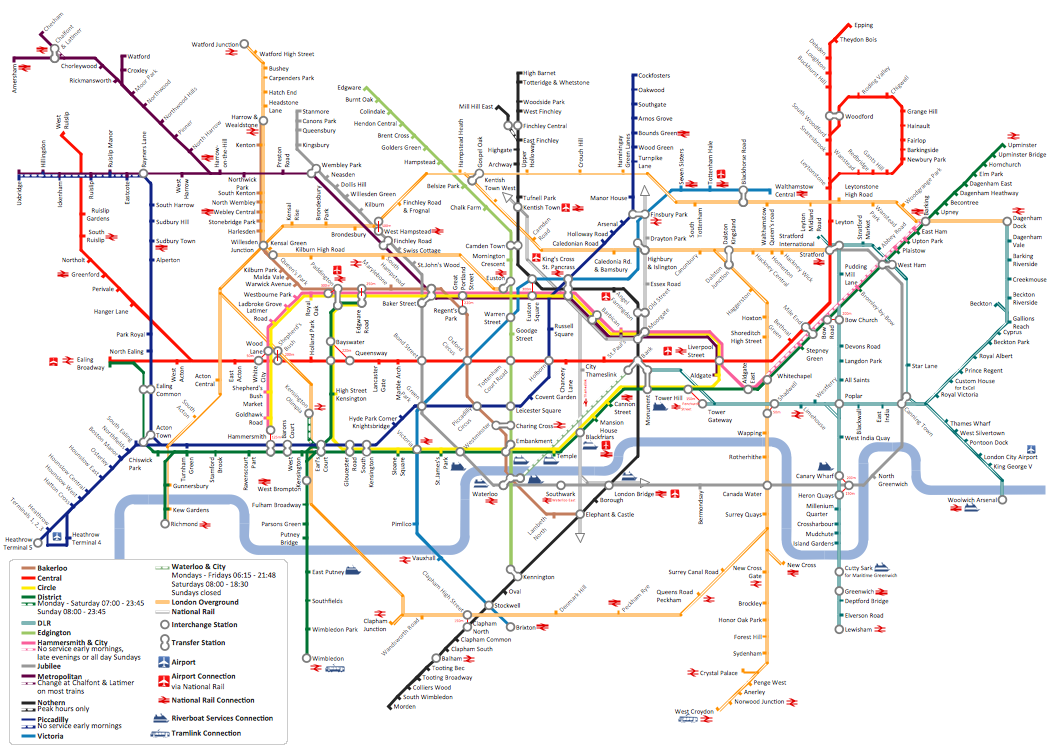
How to draw Metro Map style infographics? Moscow, New York, Los Angeles, London

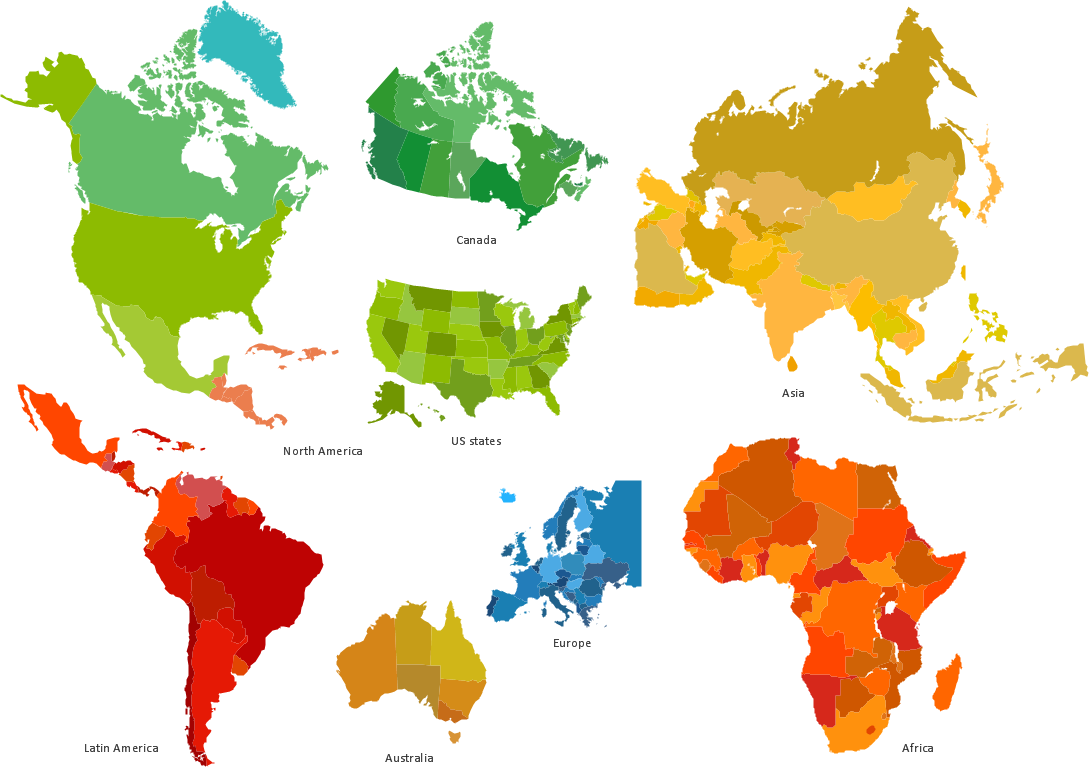
Spatial infographics Design Elements: Location Map
Subway infographic design elements - software tools

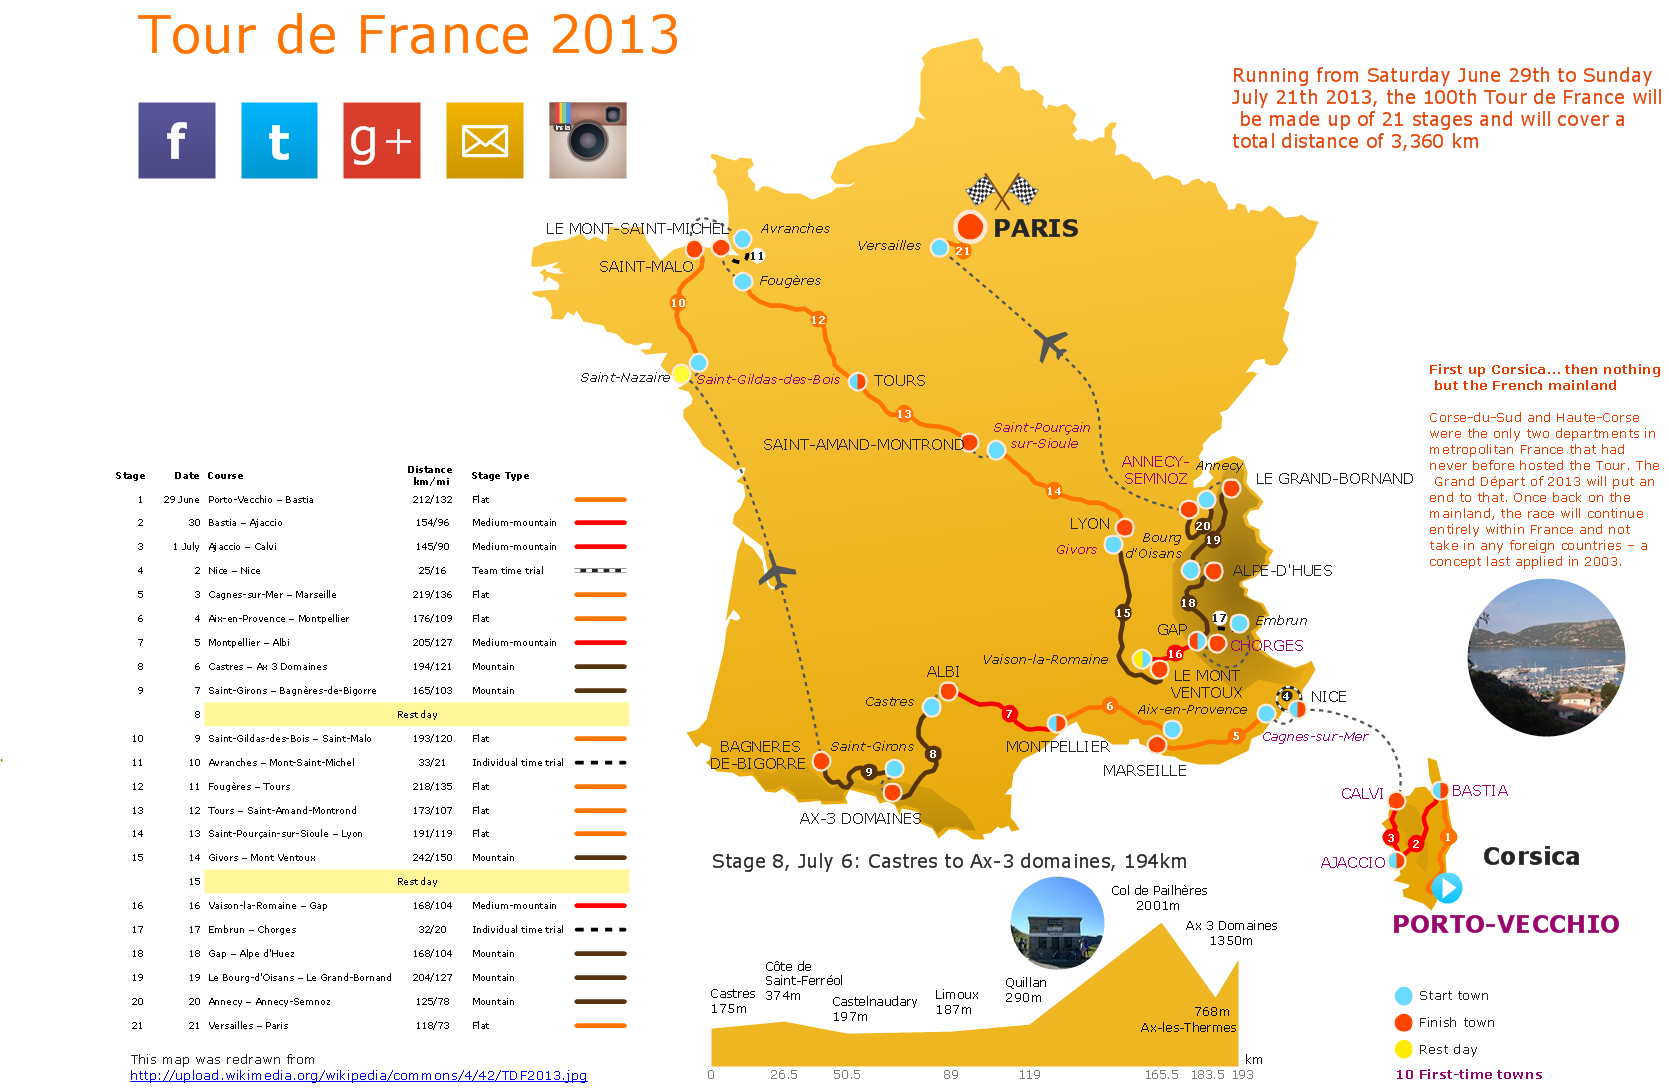
Transportation Infographics
How to draw Metro Map style infographics? (London)
HelpDesk
How to Draw a Pictorial Chart

 macOS User Interface
macOS User Interface solution extends the ConceptDraw DIAGRAM functionality with powerful GUI software graphic design features and tools. It provides an extensive range of multifarious macOS Sierra user interface design examples, samples and templates, and wide variety of libraries, containing a lot of pre-designed vector objects of Mac Apps icons, buttons, dialogs, menu bars, indicators, pointers, controls, toolbars, menus, and other elements for fast and simple designing high standard user interfaces of any complexity for new macOS Sierra.
- Top 5 Android Flow Chart Apps | Map Infographic Maker | Free ...
- Note Exchange | Quality Mind Map | Map Infographic Maker | Mind ...
- Chemistry | Infographic Tools | | Conceptdraw Office 3 Crack
- Pyramid diagrams - Vector stencils library | Best Vector Drawing ...
- Best Tool for Infographic Construction | PM Dashboards | How To ...
- Process Flowchart | Infographic Tools | Data Flow Diagram | Mind ...
- Map Infographic Design | Spatial Infographics | Map Infographic Tool ...
- Selection sorting method - Algorithm flowchart | ConceptDraw ...
- Subway infographic design elements - software tools | Process ...
- Best Tool for Infographic Construction | Gantt charts for planning and ...
- ERD | Entity Relationship Diagrams, ERD Software for Mac and Win
- Flowchart | Basic Flowchart Symbols and Meaning
- Flowchart | Flowchart Design - Symbols, Shapes, Stencils and Icons
- Flowchart | Flow Chart Symbols
- Electrical | Electrical Drawing - Wiring and Circuits Schematics
- Flowchart | Common Flowchart Symbols
- Flowchart | Common Flowchart Symbols