HelpDesk
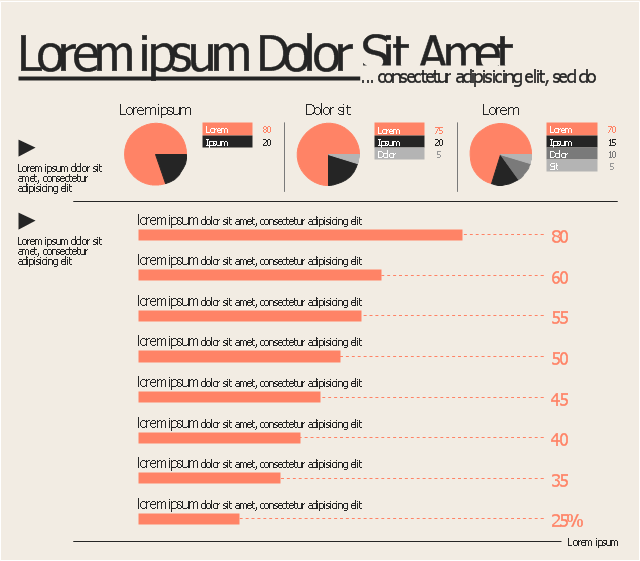
How to Create a Typography Infographic Using ConceptDraw PRO

This marketing infographic template consists of design elements: title block, callout blocks, numbered and bulleted list blocks, pictograms, titled callouts, pie chart, background.
Use it to create your marketing infograms in the ConceptDraw PRO diagramming and vector drawing software.
The template "Marketing infogram 7" is included in the Marketing Infographics solution from the Business Infographics area of ConceptDraw Solution Park.
Use it to create your marketing infograms in the ConceptDraw PRO diagramming and vector drawing software.
The template "Marketing infogram 7" is included in the Marketing Infographics solution from the Business Infographics area of ConceptDraw Solution Park.
Marketing infogram template
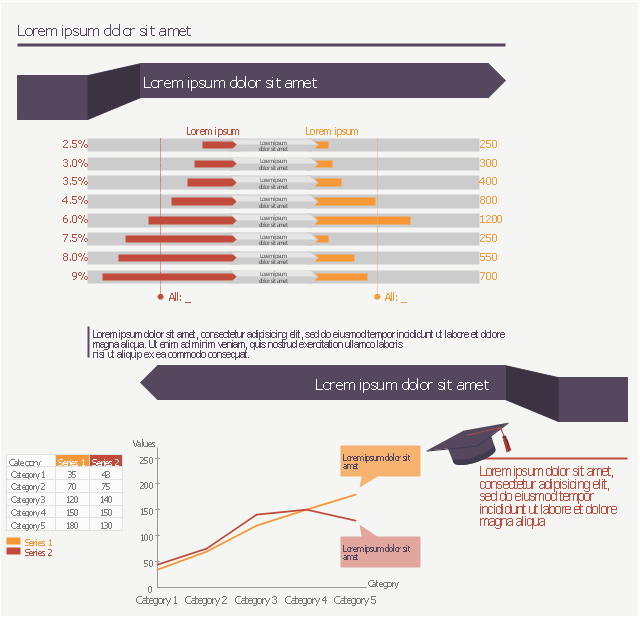
This education infographic template consists of design elements: callouts, bullet indicators, line chart, graduate cap pictogram.
Simply add text and data to design your educational infogram.
The template "Education infogram" for the ConceptDraw PRO diagramming and vector drawing software is included in the Education Infographics solition from the area "Business Infographics" in ConceptDraw Solution Park.
Simply add text and data to design your educational infogram.
The template "Education infogram" for the ConceptDraw PRO diagramming and vector drawing software is included in the Education Infographics solition from the area "Business Infographics" in ConceptDraw Solution Park.
Educational infogram template
HelpDesk
How to Create Management Infographics Using ConceptDraw PRO

ConceptDraw PRO can be used as a tool for creating management infographics. It allows you to draw infographics quickly and easily using the special templates and vector stencils libraries. Infographics can be used to quickly communicate a message, to simplify the presentation of large amounts of data, to see data patterns and relationships, and to monitor changes in variables over time. It can contain bar graphs, pie charts, histograms, line charts, e.t.c.
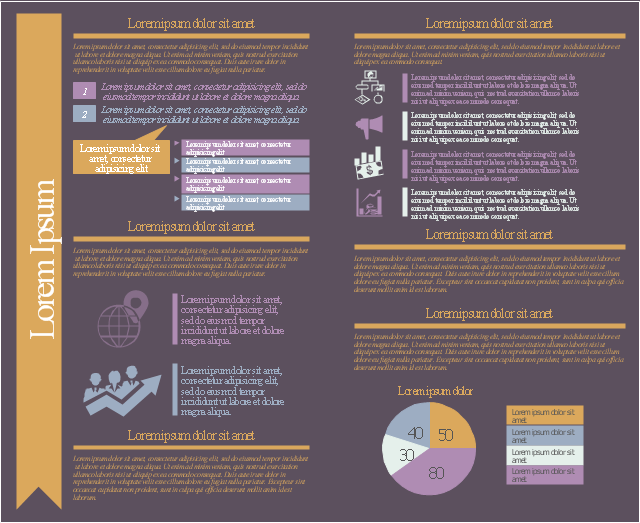
This marketing infographic template consists of design elements: title block, callout blocks, list bullets, pie chart, bullet indicators.
Use it to create your marketing infograms in the ConceptDraw PRO diagramming and vector drawing software.
The template "Marketing infogram 5" is included in the Marketing Infographics solution from the Business Infographics area of ConceptDraw Solution Park.
Use it to create your marketing infograms in the ConceptDraw PRO diagramming and vector drawing software.
The template "Marketing infogram 5" is included in the Marketing Infographics solution from the Business Infographics area of ConceptDraw Solution Park.
Marketing infogram template
Typography Infographic Software

Use the Typography Infographics Solution for ConceptDraw PRO typography infographic software to create your own professional looking Typography Infographics of any complexity quick, easy and effective, and then successfully use them in various fields.
Social Media Marketing Infographic

Typography Art

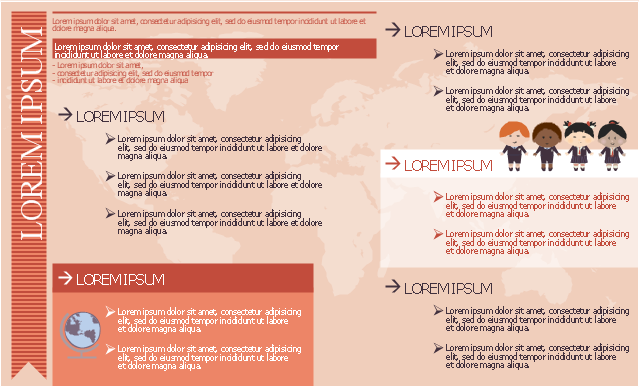
This education infographic template consists of design elements: title block, callouts, bulleted list elements, pictograms, world map background.
Simply add text to design your own educational infogram.
The template "Education infogram 3" for the ConceptDraw PRO diagramming and vector drawing software is included in the Education Infographics solition from the area "Business Infographics" in ConceptDraw Solution Park.
Simply add text to design your own educational infogram.
The template "Education infogram 3" for the ConceptDraw PRO diagramming and vector drawing software is included in the Education Infographics solition from the area "Business Infographics" in ConceptDraw Solution Park.
Educational infogram template
 Meter Dashboard
Meter dashboard solution extends ConceptDraw PRO software with templates, samples and vector stencils library with meter indicators for drawing visual dashboards showing quantitative data.
HelpDesk
How to Create a Meter Dashboard

Basic Flowchart Symbols and Meaning


SWOT Template

- Infographic Templates For Bullets
- Minnesota measures - Infogram | Education infogram 5 - Template ...
- Circle Bullets
- Infographic Templates
- How to Draw Pictorial Chart . How to Use Infograms | Sample ...
- Vector Infographic Bullets
- Bulleted List Infographic
- Indicator Infographic
- List Bullet Png
- Bullet List Designs
- Infographics Background
- Spatial infographics Design Elements: Location Map | Tools to ...
- Quick YouTube Survey | Education infogram 5 - Template ...
- Design elements - Education charts | Education infogram 4 ...
- How to Create a Typography Infographic Using ConceptDraw PRO ...
- Word Bullet Vector Png
- World Map Infographic Template
- Typography Bullet Lists
- Marketing infogram 5 - Template
- Education indicators - Vector stencils library | Chart Maker for ...
- ERD | Entity Relationship Diagrams, ERD Software for Mac and Win
- Flowchart | Basic Flowchart Symbols and Meaning
- Flowchart | Flowchart Design - Symbols, Shapes, Stencils and Icons
- Flowchart | Flow Chart Symbols
- Electrical | Electrical Drawing - Wiring and Circuits Schematics
- Flowchart | Common Flowchart Symbols
- Flowchart | Common Flowchart Symbols