How to Create a Social Media DFD Flowchart

It allows companies to be more effective in timely messaging thanks to the ability for rapid response to a customer′s post in social media. This saves budget for companies who use social media for promoting and as a lead generation tool.
Create Response Charts

HelpDesk
How to Create a Fishbone (Ishikawa) Diagram Quickly
 Diagram Quickly")
Interactive Training Tool

Why People Select ConceptDraw MINDMAP

Root Cause Tree Diagram

Affinity Diagram

HelpDesk
How To Create the Interaction (Relations) Diagram
 Diagram")
Looking at ConceptDraw MINDMAP as a Replacement for Mindjet Mindmanager

Economical. (Lower license price, support is no charge maintenance is an optional one-time fee that delivers to you the next major release) ConceptDraw products are structured to save you money from the date of purchase for the life of the product. When you compare ConceptDraw MINDMAP to Mindjet Mindmanager the cost savings will be obvious.
Flexible Licensing. ConceptDraw is licensed per-named-user. Want ConceptDraw on 2 PCs, 2 Macs, or a PC and a Mac? Straightforward licensing makes this easy.
 eLearning for Skype
This solution extends ConceptDraw MINDMAP software with the ability to prepare and run remote learning sessions by using Skype
HelpDesk
How To Create an Affinity Diagram Using Solutions

Genomics
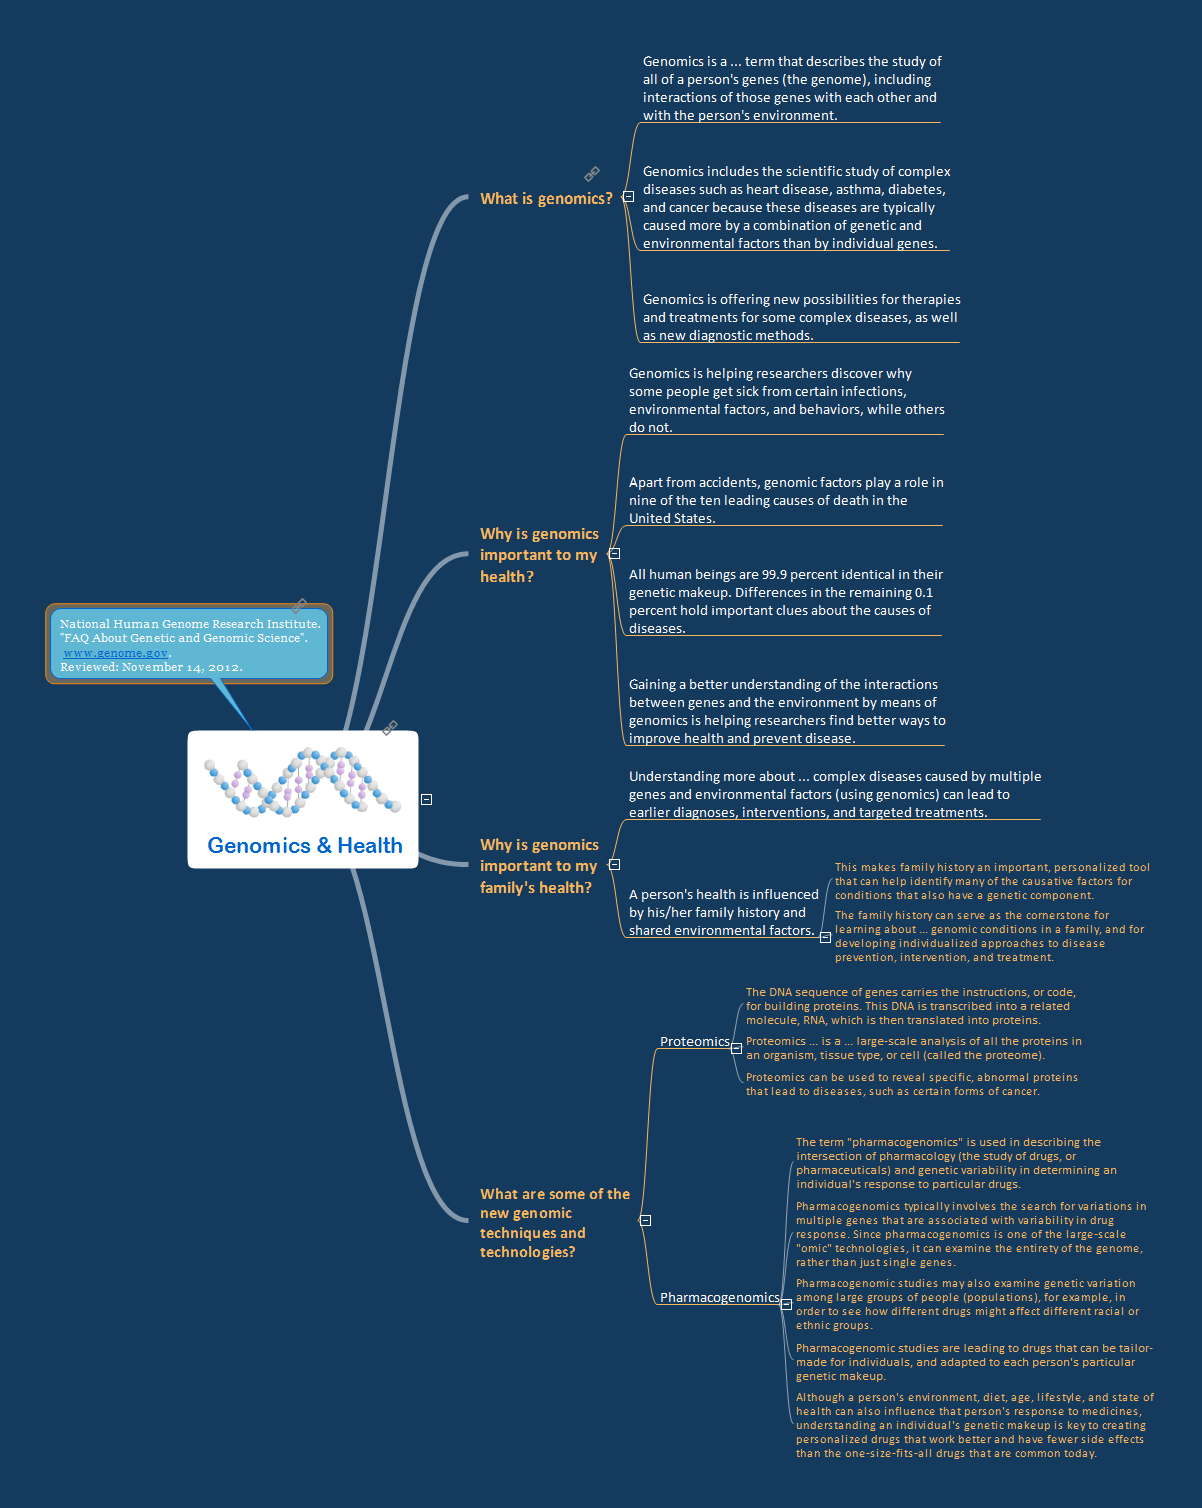
This map was created from content found at "FAQ About Genetic and Genomic Science" (National Human Genome Research Institute, www.genome.gov) and shows how simple in is to use a map structure to explain complex subjects. The content from this map and maps similar to this can be used with the eLearning for Skype solution for ConceptDraw MINDMAP to present complex information in a simplified manner.
Learning with MindMap

ConceptDraw MINDMAP is an ideal software tool for learning process. It combines great tools for all activities from organizing to accomplishing learning process - prepare lectures and learning materials, provide trainings and test knowledge with students, make presentations, problem solve, brainstorming, and much more.
UML Use Case Diagram Example. Social Networking Sites Project

This sample shows the Facebook Socio-health system and is used at the projection and creating of the social networking sites.
- Influence Of Media Mind Map
- Mind Maps for Business - SWOT Analysis | SWOT Template | SWOT ...
- Mind Maps for Business - SWOT Analysis | SWOT Analysis | SWOT ...
- Example Social Media Mind Map Social Media Analysis
- Social strategy - Pyramid diagram | Online store social media ...
- Mind Maps for Business - SWOT Analysis | SWOT analysis matrix ...
- How to Create a Social Media DFD Flowchart | UML Use Case ...
- Software for Creating SWOT Analysis Diagrams | Mind Maps for ...
- Conceptdraw Mindmap Flowchart Symbols
- SWOT Analysis Solution - Strategy Tools | Mind Maps for Business ...
- Social Media Marketing Infographic | How to Create a Social Media ...
- Process Flowchart | Learning with MindMap | Types of Flowcharts ...
- Flowchart Example: Flow Chart of Marketing Analysis | Social Media ...
- Mind Map Of E Commerce Website Example
- How to show a mind map presentation via Skype | Remote Projects ...
- Bank social media response flowchart
- Learning with MindMap | Flow chart Example. Warehouse Flowchart ...
- Mind Maps for Business - SWOT Analysis | Porter's Value Chain ...
- Swot Analysis Examples | Mind Maps for Business - SWOT Analysis ...
- Fire and Emergency Plans | Seven Basic Tools of Quality | Mind Map ...
- ERD | Entity Relationship Diagrams, ERD Software for Mac and Win
- Flowchart | Basic Flowchart Symbols and Meaning
- Flowchart | Flowchart Design - Symbols, Shapes, Stencils and Icons
- Flowchart | Flow Chart Symbols
- Electrical | Electrical Drawing - Wiring and Circuits Schematics
- Flowchart | Common Flowchart Symbols
- Flowchart | Common Flowchart Symbols