The exploded pie chart example "European Parliament election" was redesigned from the Wikipedia file: Pie_ chart_ EP_ election_ 2004_ exploded.png [en.wikipedia.org/ wiki/ File:Pie_ chart_ EP_ election_ 2004_ exploded.png ].
This file is available under the Creative Commons Attribution-ShareAlike 3.0 Unported License [creativecommons.org/ licenses/ by-sa/ 3.0/ ].
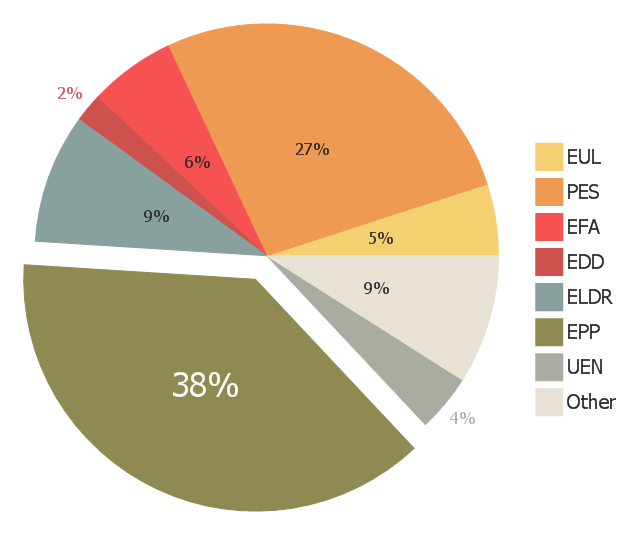
"Elections to the European Parliament take place every five years by universal adult suffrage. 751 MEPs (Members of the European Parliament) are elected to the European Parliament which has been directly elected since 1979. No other EU institution is directly elected, with the Council of the European Union and the European Council being only indirectly legitimated through national elections. While Europarties have the right to campaign EU-wide for the European elections, campaigns are still taking place through national election campaigns, advertising national delegates from national parties." [Elections to the European Parliament. Wikipedia]
"A chart with one or more sectors separated from the rest of the disk is known as an exploded pie chart. This effect is used to either highlight a sector, or to highlight smaller segments of the chart with small proportions." [Pie chart. Wikipedia]
The exploded pie chart example "European Parliament election" was created using the ConceptDraw PRO diagramming and vector drawing software extended with the Pie Charts solution of the Graphs and Charts area in ConceptDraw Solution Park.
www.conceptdraw.com/ solution-park/ charts-pie
This file is available under the Creative Commons Attribution-ShareAlike 3.0 Unported License [creativecommons.org/ licenses/ by-sa/ 3.0/ ].
"Elections to the European Parliament take place every five years by universal adult suffrage. 751 MEPs (Members of the European Parliament) are elected to the European Parliament which has been directly elected since 1979. No other EU institution is directly elected, with the Council of the European Union and the European Council being only indirectly legitimated through national elections. While Europarties have the right to campaign EU-wide for the European elections, campaigns are still taking place through national election campaigns, advertising national delegates from national parties." [Elections to the European Parliament. Wikipedia]
"A chart with one or more sectors separated from the rest of the disk is known as an exploded pie chart. This effect is used to either highlight a sector, or to highlight smaller segments of the chart with small proportions." [Pie chart. Wikipedia]
The exploded pie chart example "European Parliament election" was created using the ConceptDraw PRO diagramming and vector drawing software extended with the Pie Charts solution of the Graphs and Charts area in ConceptDraw Solution Park.
www.conceptdraw.com/ solution-park/ charts-pie
Exploded pie chart

Pie Graph

The exploded pie chart example "European Parliament election" was redesigned from the Wikipedia file: Pie_ chart_ EP_ election_ 2004_ exploded.png [en.wikipedia.org/ wiki/ File:Pie_ chart_ EP_ election_ 2004_ exploded.png ].
This file is available under the Creative Commons Attribution-ShareAlike 3.0 Unported License [creativecommons.org/ licenses/ by-sa/ 3.0/ ].
"Elections to the European Parliament take place every five years by universal adult suffrage. 751 MEPs (Members of the European Parliament) are elected to the European Parliament which has been directly elected since 1979. No other EU institution is directly elected, with the Council of the European Union and the European Council being only indirectly legitimated through national elections. While Europarties have the right to campaign EU-wide for the European elections, campaigns are still taking place through national election campaigns, advertising national delegates from national parties." [Elections to the European Parliament. Wikipedia]
"A chart with one or more sectors separated from the rest of the disk is known as an exploded pie chart. This effect is used to either highlight a sector, or to highlight smaller segments of the chart with small proportions." [Pie chart. Wikipedia]
The exploded pie chart example "European Parliament election" was created using the ConceptDraw PRO diagramming and vector drawing software extended with the Pie Charts solution of the Graphs and Charts area in ConceptDraw Solution Park.
Exploded pie chart
Donut Chart Templates

All these donut chart templates are included in the Pie Charts solution.
You can quickly rework these examples into your own charts by simply changing displayed data, title and legend texts.
 Pie Charts
Pie Charts solution extends ConceptDraw PRO software with templates, samples and library of vector stencils for drawing the pie and donut charts.
Pie Chart Examples and Templates

Chart Templates

Chart Maker for Presentations

- Exploded pie chart - European Parliament election | European ...
- Exploded pie chart (percentage)
- Donut Chart Templates | Pie Chart Examples and Templates | Donut ...
- London election results - Divided bar diagram | Basic Flowchart ...
- How to Create a Pie Chart | How to Draw a Pie Chart Using ...
- London election results - Divided bar diagram | Bar Diagram Math ...
- Graphs and Charts Area | Pie Charts | Chart Maker for Presentations ...
- European Parliament Election 2004 In Piechart
- Federal timeline US prisoners - Area chart | London election results ...
- European Parliament election - Exploded pie chart
- Exploded pie chart - European Parliament election
- Pie Chart Software | Pie Chart Examples and Templates | Pie Chart ...
- How to Draw a Divided Bar Chart in ConceptDraw PRO | London ...
- Basic Flowchart Images. Flowchart Examples | Donut Chart ...
- How to Draw a Divided Bar Chart in ConceptDraw PRO | Divided ...
- Bar Diagrams for Problem Solving. Create space science bar charts ...
- London election results - Divided bar diagram | What is a Dashboard ...
- How to Draw a Divided Bar Chart in ConceptDraw PRO | London ...
- Divided Bar Diagrams | Divided bar diagram - Template | Bar ...
- Exploded pie chart (percentage) - Template | Sector weightings ...
- ERD | Entity Relationship Diagrams, ERD Software for Mac and Win
- Flowchart | Basic Flowchart Symbols and Meaning
- Flowchart | Flowchart Design - Symbols, Shapes, Stencils and Icons
- Flowchart | Flow Chart Symbols
- Electrical | Electrical Drawing - Wiring and Circuits Schematics
- Flowchart | Common Flowchart Symbols
- Flowchart | Common Flowchart Symbols