Basic Flowchart Symbols and Meaning


Entity Relationship Diagram Symbols

ERD symbols used for professional ERD drawing are collected in libraries from the Entity-Relationship Diagram (ERD) solution for ConceptDraw DIAGRAM.
ERD Symbols and Meanings

The Chen's ERD notation is still used and is considered to present a more detailed way of representing entities and relationships.
To create an ERD, software engineers mainly turn to dedicated drawing software, which contain the full notation resources for their specific database design - ERD symbols and meanings. CS Odessa has released an all-inclusive Entity-Relationship Diagram (ERD) solution for their powerful drawing program, ConceptDraw DIAGRAM.

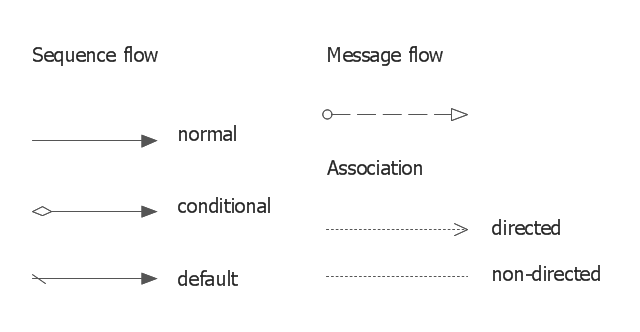
The vector stencils library "Connections BPMN1.2" contains 6 connection symbols of sequence flow, message flow, and association.
Use these shapes for drawing business process diagrams (BPMN 1.2) using the ConceptDraw PRO diagramming and vector drawing software.
"Connections.
Flow objects are connected to each other using Connecting objects, which are of three types: sequences, messages, and associations.
(1) Sequence Flow.
A Sequence Flow is represented with a solid line and arrowhead, and shows in which order the activities are performed. The sequence flow may also have a symbol at its start, a small diamond indicates one of a number of conditional flows from an activity, while a diagonal slash indicates the default flow from a decision or activity with conditional flows.
(2) Message Flow.
A Message Flow is represented with a dashed line, an open circle at the start, and an open arrowhead at the end. It tells us what messages flow across organizational boundaries (i.e., between pools). A message flow can never be used to connect activities or events within the same pool.
(3) Association.
An Association is represented with a dotted line. It is used to associate an Artifact or text to a Flow Object, and can indicate some directionality using an open arrowhead (toward the artifact to represent a result, from the artifact to represent an input, and both to indicate it is read and updated). No directionality is used when the Artifact or text is associated with a sequence or message flow (as that flow already shows the direction)." [Business Process Model and Notation. Wikipedia]
The example "Design elements - Connections BPMN1.2" is included in the Business Process Diagram solution from the Business Processes area of ConceptDraw Solution Park.
BPMN1.2 connection symbols
Use Case Diagrams technology with ConceptDraw DIAGRAM

Material Requisition Flowchart. Flowchart Examples

The flowchart example shows the material requisition business process.
- In Bpmn Notation A Solid Line With An Arrow On One End
- Bpmn 1 2 Diagram
- Bpmn 1 2
- Design elements - Gateways and artifacts BPMN 1.2 | Design ...
- Connection BPMN 1.2 - Vector stencils library | Design elements ...
- Bpmn Message End Event
- Design elements - Connections BPMN1.2 | Swimlanes - Vector ...
- Design elements - Gateways and artifacts BPMN 1.2 | Artifacts ...
- How to Create Flowchart Using Standard Flowchart Symbols ...
- Design elements - Soccer (Football) positions | Design elements ...
- ERD | Entity Relationship Diagrams, ERD Software for Mac and Win
- Flowchart | Basic Flowchart Symbols and Meaning
- Flowchart | Flowchart Design - Symbols, Shapes, Stencils and Icons
- Flowchart | Flow Chart Symbols
- Electrical | Electrical Drawing - Wiring and Circuits Schematics
- Flowchart | Common Flowchart Symbols
- Flowchart | Common Flowchart Symbols