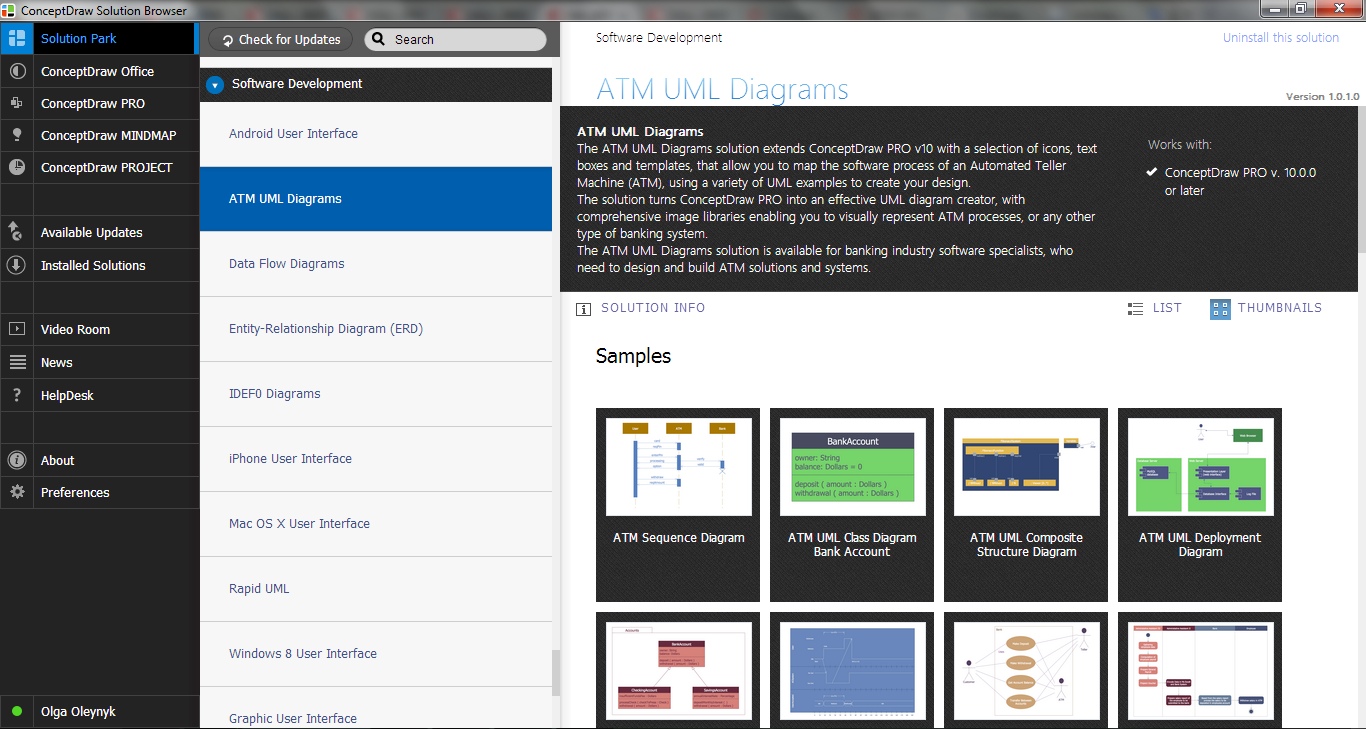
 ATM UML Diagrams
The ATM UML Diagrams solution lets you create ATM solutions and UML examples. Use ConceptDraw PRO as a UML diagram creator to visualize a banking system.
ATM Solutions
In the modern world the ATM Solutions are necessity for various software specialists, designers and developers in banking industry. ConceptDraw PRO diagramming and vector drawing software offers the unique ATM UML Diagrams Solution from the Software Development Area of ConceptDraw Solution Park.Process Flowchart
ConceptDraw is Professional business process mapping software for making process flow diagram, workflow diagram, general flowcharts and technical illustrations for business documents. It is includes rich examples, templates, process flowchart symbols. ConceptDraw flowchart maker allows you to easier create a process flowchart. Use a variety of drawing tools, smart connectors, flowchart symbols and shape libraries to create flowcharts of complex processes, process flow diagrams, procedures and information exchange.
UML Use Case Diagrams
ConceptDraw has several examples that help you to start using software for designing UML Use Case Diagrams.
 Software Development Area
Solutions from the Software Development Area of ConceptDraw Solution Park collect templates, samples and libraries of vector stencils for drawing the software engineering diagrams and user interface design prototypes.
 Fishbone Diagram
Fishbone Diagrams solution extends ConceptDraw PRO software with templates, samples and library of vector stencils for drawing the Ishikawa diagrams for cause and effect analysis.
 Entity-Relationship Diagram (ERD)
Entity-Relationship Diagram (ERD) solution extends ConceptDraw PRO software with templates, samples and libraries of vector stencils from drawing the ER-diagrams by Chen's and crow’s foot notations.
Types of Flowchart - Overview
When designing a process or an instruction in clear way, you should consider creating a flowchart. A Process Flow Diagram is the method. You can avoid wasting a lot of time understanding complex concepts as they get clear with different diagrams.
 Plant Layout Plans
This solution extends ConceptDraw PRO v.9.5 plant layout software (or later) with process plant layout and piping design samples, templates and libraries of vector stencils for drawing Plant Layout plans. Use it to develop plant layouts, power plant desig
 Engineering
This solution extends ConceptDraw PRO v9.4 with the ability to visualize industrial systems in electronics, electrical, chemical, process, and mechanical engineering.
 Pie Charts
Pie Charts are extensively used in statistics and business for explaining data and work results, in mass media for comparison (i.e. to visualize the percentage for the parts of one total), and in many other fields. The Pie Charts solution for ConceptDraw PRO v10 offers powerful drawing tools, varied templates, samples, and a library of vector stencils for simple construction and design of Pie Charts, Donut Chart, and Pie Graph Worksheets.
HelpDesk
How to Create an IDEF0 Diagram for an Application Development
IDEF0 methods are intended to model the functions of a process, creating a graphical model that displays: what controls the function, who makes it, what resources are used and how they are connected with other functions. The IDEF0 tool is used to model the decisions, actions, and activities of a software system during the development process . IDEF0 diagram graphically depicts a model of a desired version of the application. ConceptDraw PRO allows you to create and communicate the IDEF0 diagrams of any complexity.- Diagram Banking Industry By Using Swot
- Data Flow Diagrams (DFD) | ATM UML Diagrams | Bank System ...
- ATM Solutions | UML Deployment Diagram Example - ATM System ...
- ATM UML Diagrams | ATM Solutions | Bank UML Diagram | Atm Uml ...
- Uml Diagrams For Bank Pdf
- ATM UML Diagrams | | UML Use Case Diagram Example. Services ...
- Entity Relationship Diagram Example With Banking Industry
- How To Design Atm Machine Working In Banking System
- Example Of Dfd And Erd Banking System
- ATM UML Diagrams | UML Tool & UML Diagram Examples | UML ...
- Diagram Of Web Banking
- ATM UML Diagrams | ATM Solutions | ConceptDraw Solution Park ...
- ATM UML Diagrams | UML Deployment Diagram Example - ATM ...
- Flowchart on Bank . Flowchart Examples | Flowchart Examples and ...
- Flow Chart Banking System
- ATM UML Diagrams | Banking System | UML Diagram | Uml ...
- UML Deployment Diagram Example - ATM System | UML Use Case ...
- UML Activity Diagram | ATM UML Diagrams | How to Create a Bank ...
- Er Diagram For Atm Banking System
- UML Deployment Diagram Example - ATM System | How to Create a ...
- ERD | Entity Relationship Diagrams, ERD Software for Mac and Win
- Flowchart | Basic Flowchart Symbols and Meaning
- Flowchart | Flowchart Design - Symbols, Shapes, Stencils and Icons
- Flowchart | Flow Chart Symbols
- Electrical | Electrical Drawing - Wiring and Circuits Schematics
- Flowchart | Common Flowchart Symbols
- Flowchart | Common Flowchart Symbols


