 Picture Graphs
Typically, a Picture Graph has very broad usage. They many times used successfully in marketing, management, and manufacturing. The Picture Graphs Solution extends the capabilities of ConceptDraw PRO v10 with templates, samples, and a library of professionally developed vector stencils for designing Picture Graphs.
 Basic Picture Graphs
This solution extends the capabilities of ConceptDraw PRO v10.3.0 (or later) with templates, samples and a library of vector stencils for drawing Picture Graphs.
Geo Map - Oceania

Infographic Maker

Area Chart

 Education Package
Education Package is a comprehensive set of multifarious graphical solutions from ConceptDraw Solution Park, collected together in help to ConceptDraw PRO users working in a field of science, education and training, which is aimed at improving the quality of education and helping to design with ease variety of interesting and colorful educational materials, diagrams, charts and maps. Use it to present the information and knowledge in an interesting, clear, structured and simple form to achieve a success in education and pedagogy, to maintain the interest of students and pupils throughout the whole learning process, at the lectures, lessons and even during independent work with additional materials, to contribute to better perception of scientific information by listeners during the conferences and reports.
Geo Map - Asia - Japan

The vector stencils library Japan contains contours for ConceptDraw PRO diagramming and vector drawing software. This library is contained in the Continent Maps solution from Maps area of ConceptDraw Solution Park.
Geo Map — Europe — Poland

Sample Pictorial Chart. Sample Infographics
")
Use Pictorial Infographics solution to draw your own design pictorial infographics documents quick and easy.
Geo Map of Americas

ConceptDraw is idea to draw the geological maps of America from the pre-designed vector geo map shapes and vector images map of america.
Use Continent Maps solution from the Maps area of ConceptDraw Solution Park to draw thematic maps, geospatial infographics and vector illustrations for your business documents, presentations and websites.
How to Draw Pictorial Chart. How to Use Infograms

Pictorial Infographics solution contains large number of libraries with variety of predesigned vector pictograms that allows you design infographics in minutes. There are available 10 libraries with 197 vector pictograms.
Geo Map - Africa
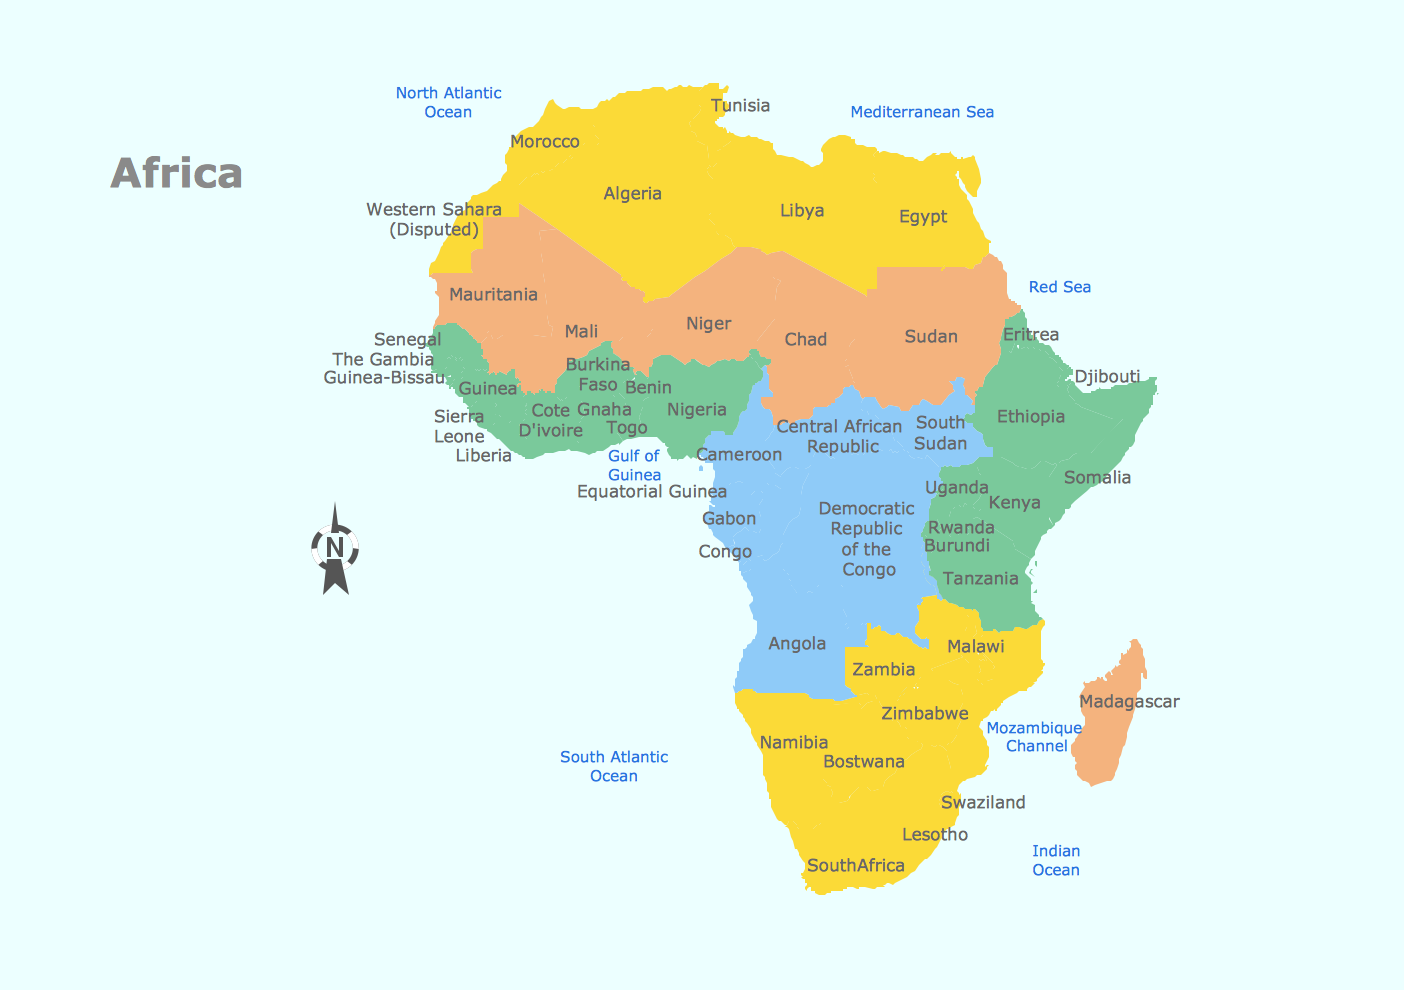
Vector design elements library Africa contains country map contours, geographical maps, cartograms and thematic maps for ConceptDraw PRO diagramming and vector drawing software. To help visualize the business and thematic information connected with geographic areas, locations or customs.
All ConceptDraw PRO documents are vector graphic files and are available for reviewing, modifying, and converting to a variety of formats: image, HTML, PDF file, MS PowerPoint Presentation, Adobe Flash, MS Visio (.VDX, .VSDX).
Types of Flowchart - Overview


Best Tool for Infographic Construction

Sales Plan

- Image On Population Education
- Population Education Images
- Draw Image Of Population Education
- Population Education Pictures Chart Making
- Population Education Picture
- Population Education With Diagram
- Population Education Diagram
- Flow Chart Of Population Education Images
- Education Package | Pie Charts | Population Education Digram
- Population Flow Chart Or Diagram Images
- Image Draw Population
- Population Education Using Diagrams
- Best Drawing Population Education
- How To Draw Population Control Picture
- Diagram Of Population Education
- Easy Population Mind Map Pictures
- Population Pictogram
- Population Images Chart
- Picture Graphs | Picture Graph | How to Create a Picture Graph in ...
- Basic Flowchart Images . Flowchart Examples | Image chart - The ...
- ERD | Entity Relationship Diagrams, ERD Software for Mac and Win
- Flowchart | Basic Flowchart Symbols and Meaning
- Flowchart | Flowchart Design - Symbols, Shapes, Stencils and Icons
- Flowchart | Flow Chart Symbols
- Electrical | Electrical Drawing - Wiring and Circuits Schematics
- Flowchart | Common Flowchart Symbols
- Flowchart | Common Flowchart Symbols