Personal area (PAN) networks. Computer and Network Examples
 networks")
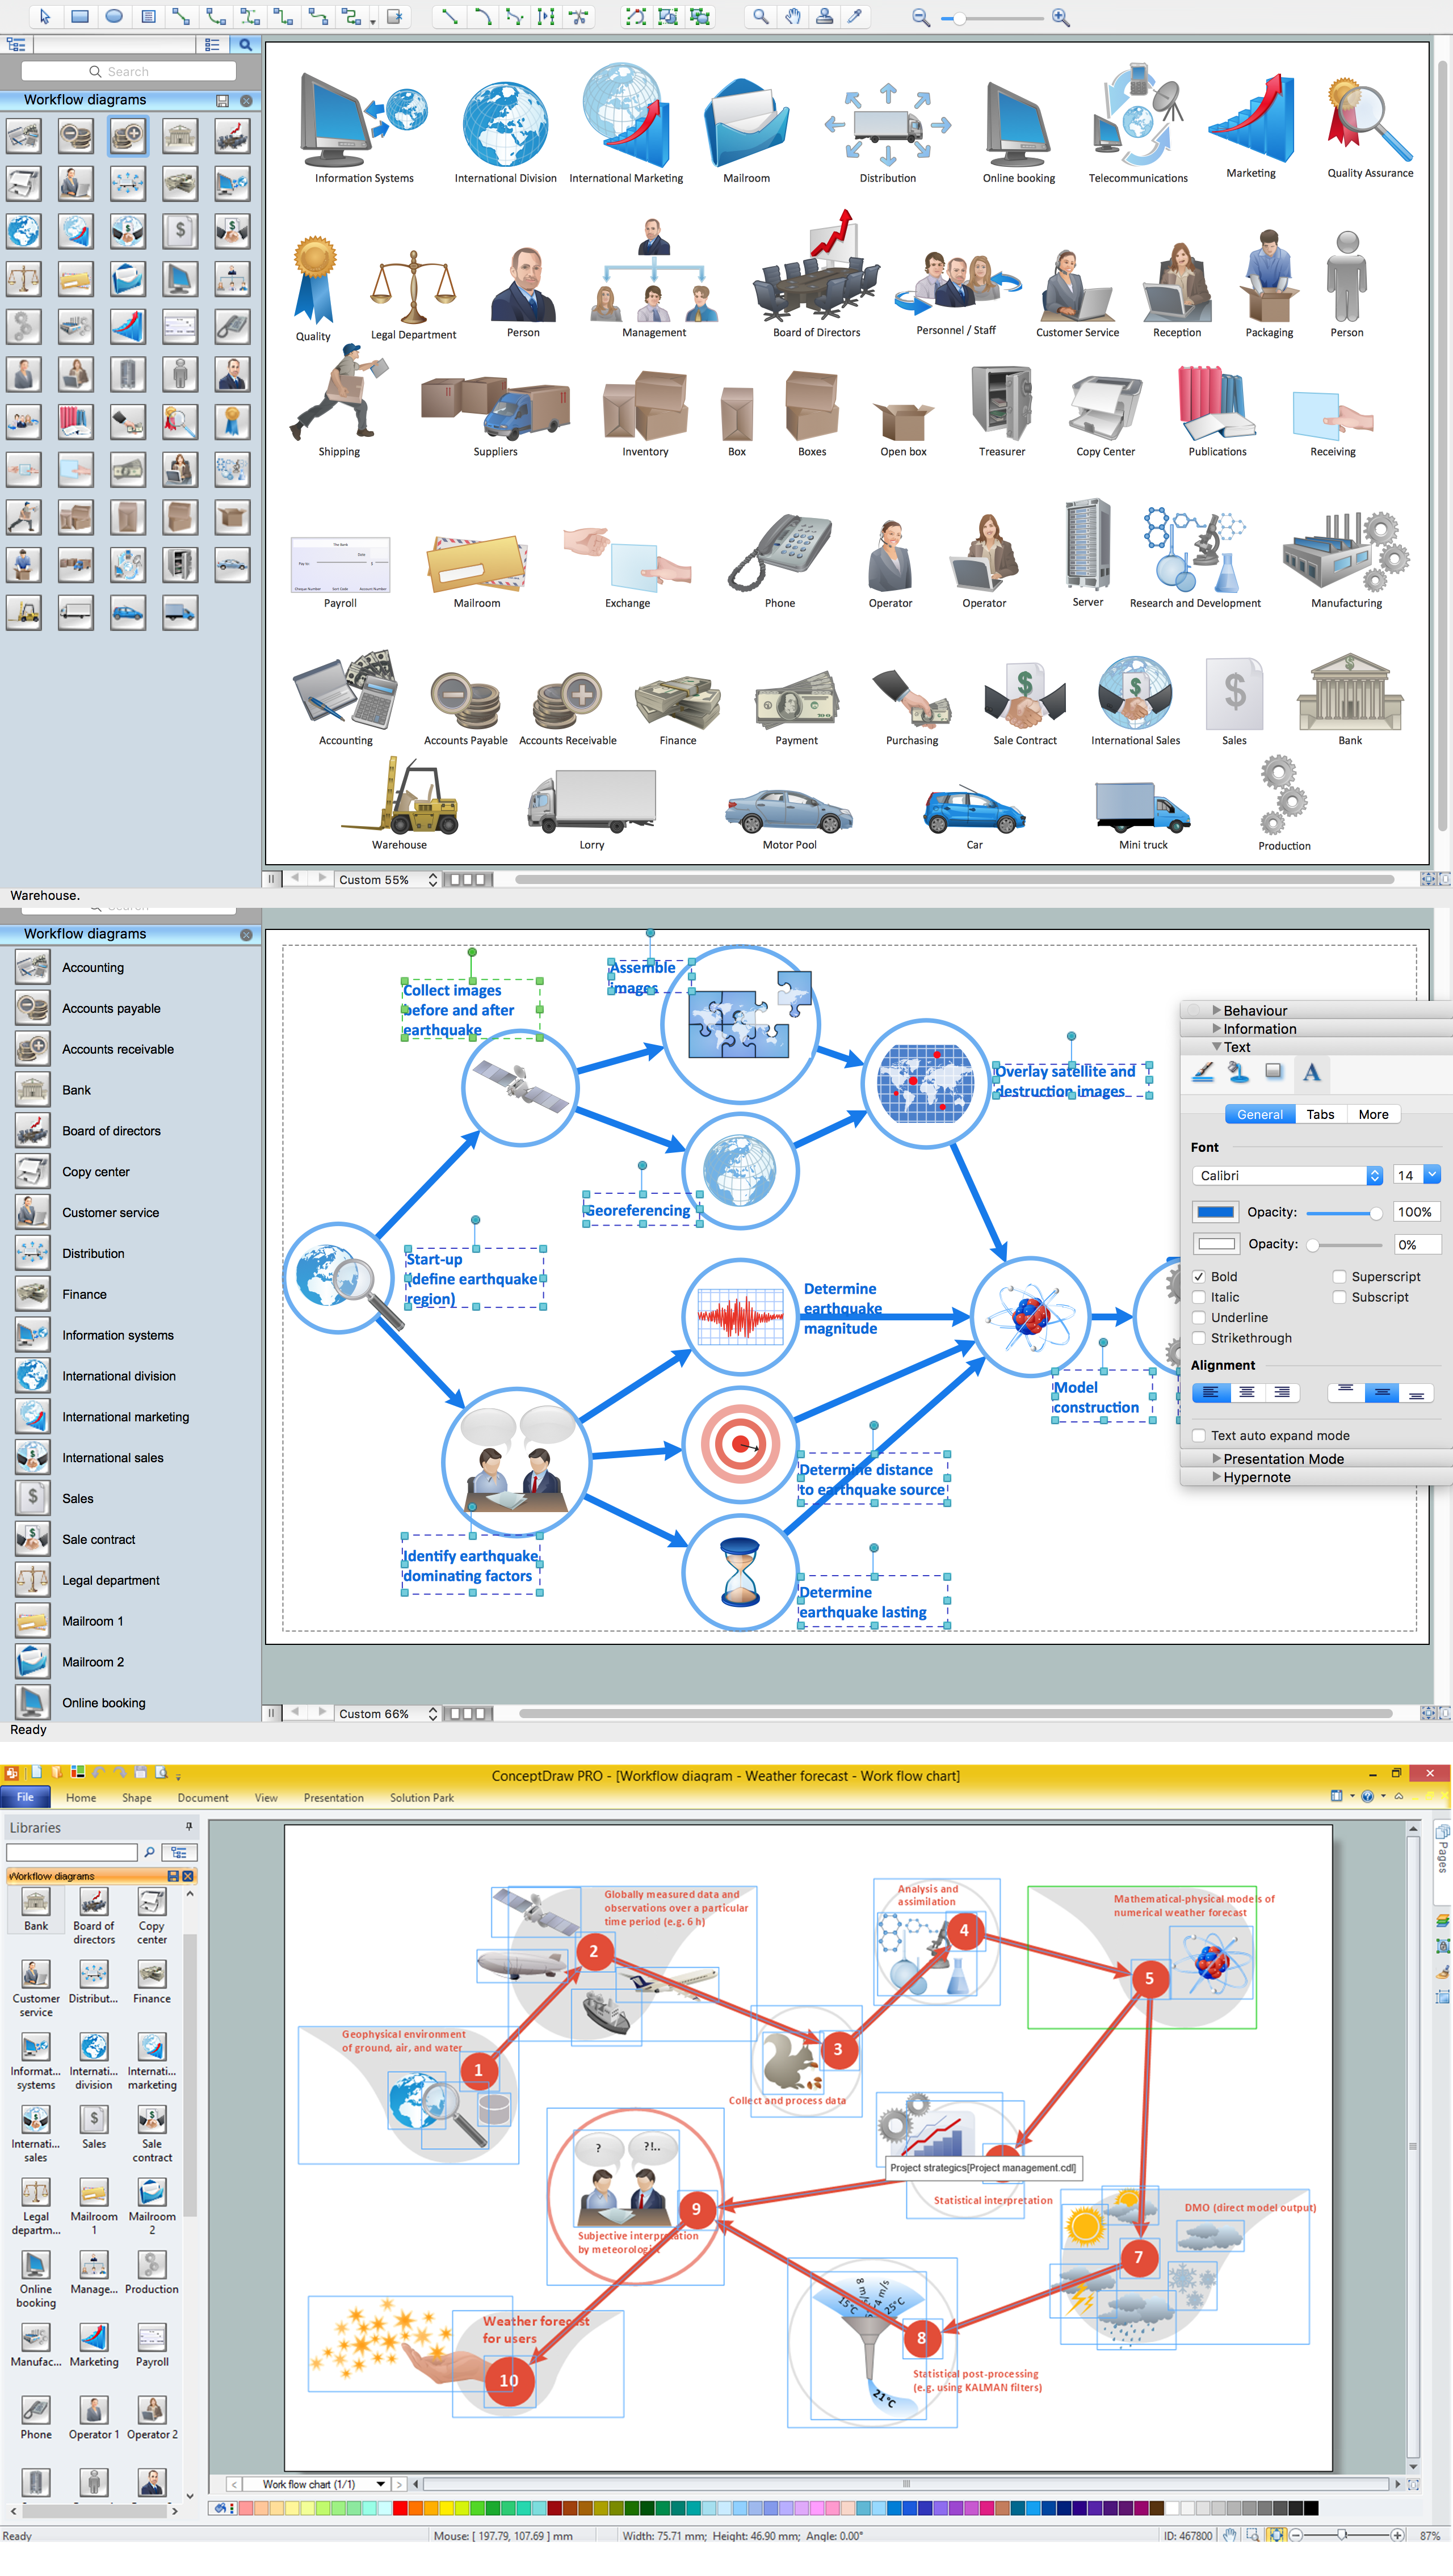
This example was created in ConceptDraw DIAGRAM using the Computer and Networks Area of ConceptDraw Solution Park and shows the Personal area network.

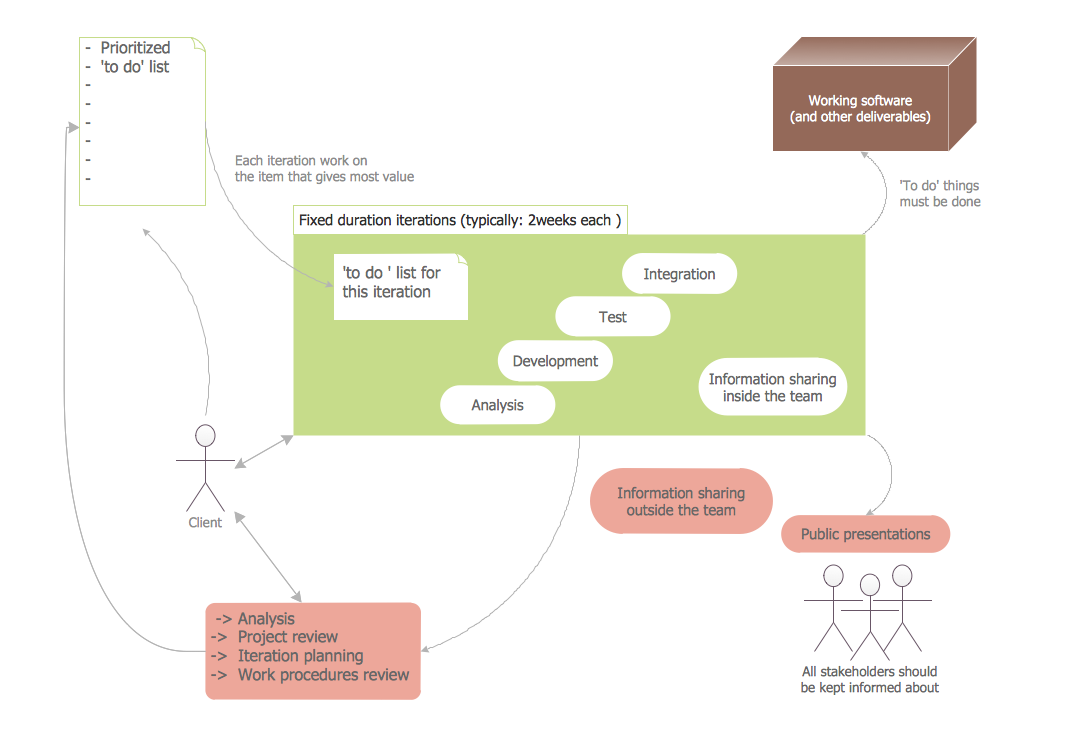
Workflow Diagram Examples
 Fishbone Diagrams
The Fishbone Diagrams solution extends ConceptDraw DIAGRAM software with the ability to easily draw the Fishbone Diagrams (Ishikawa Diagrams) to clearly see the cause and effect analysis and also problem solving. The vector graphic diagrams produced using this solution can be used in whitepapers, presentations, datasheets, posters, and published technical material.
Cause and Effect Diagram Software

You can design your Cause and Effect diagram on a paper, but more effective way is to use specific software - ConceptDraw DIAGRAM is a powerful Cause and Effect Diagram Software. It helps you create Cause and Effect diagram known also as Fishbone diagram or Ishikawa diagram from templates and examples.
Fishbone Problem Solving

ConceptDraw DIAGRAM diagramming and vector drawing software extended with Fishbone Diagrams Solution from the Management Area of ConceptDraw Solution Park is a powerful Fishbone Problem Solving tool.
Improving Problem Solving and Focus with Fishbone Diagrams

ConceptDraw DIAGRAM extended with Fishbone Diagrams solution gives a powerful tool for improving problem solving and focus with Fishbone diagrams.
Software Diagram Templates
The Software Diagrams designed with ConceptDraw DIAGRAM are vector graphic documents and are available for reviewing, modifying, converting to a variety of formats (image, HTML, PDF file, MS PowerPoint Presentation, Adobe Flash or MS Visio XML), printing and send via e-mail in one moment.
PROBLEM ANALYSIS. Root Cause Analysis Tree Diagram

ConceptDraw Office suite is a software for problem analysis.

Example of DFD for Online Store (Data Flow Diagram)

Example of DFD for Online Store shows the Data Flow Diagram for online store and interactions between the Visitors, Customers and Sellers, as well as Website Information and User databases.

HR Management Software

The HR Management Software is an incredibly powerful tool for those who need to analyze or present human resource process flows in a visually effective manner.
Blank Calendar Template

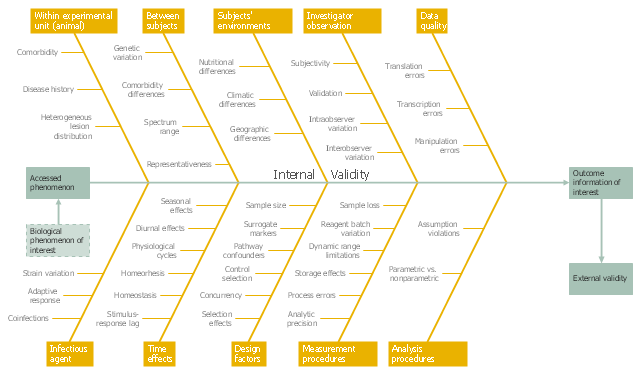
This example was created on the base of the figure from the website of the WSU College of Veterinary Medicine of the Washington State University. [vetmed.wsu.edu/ courses-jmgay/ images/ Ishikawa%20 Variance%20 Diagram.jpg]
"Internal validity is a property of scientific studies which reflects the extent to which a causal conclusion based on a study is warranted. Such warrant is constituted by the extent to which a study minimizes systematic error (or 'bias')." [Internal validity. Wikipedia]
The fishbone diagram example "Ishikawa variance diagram" was created using the ConceptDraw PRO diagramming and vector drawing software extended with the Fishbone Diagrams solution from the Management area of ConceptDraw Solution Park.
Ishikawa diagram
In searching of alternative to MS Visio for MAC and PC with ConceptDraw DIAGRAM

Visio for mac — ConceptDraw as an alternative to MS Visio. ConceptDraw has been developed to satisfy all your needs as a fully-functioned alternative product to MS Visio for Mac.
Planogram Software and Retail Plan Software

 Fishbone Diagram
Fishbone Diagrams solution extends ConceptDraw DIAGRAM software with templates, samples and library of vector stencils for drawing the Ishikawa diagrams for cause and effect analysis.
- Images Of Fishbone Diagram
- Fishbone Diagram | Fishbone diagram - HAN project | Fishbone ...
- Fishbone Diagram | Fishbone Diagrams | ConceptDraw Solution ...
- Value Stream Mapping | Fishbone Diagrams | Entity-Relationship ...
- Fishbone Diagrams | Audio and Video Connectors | Class Diagram ...
- Fishbone Problem Solving | Fishbone Diagrams | Fishbone Diagram ...
- Safety and Security | Food Court | AWS Architecture Diagrams ...
- Value Stream Mapping | Fishbone Diagram | Metro Map | Image ...
- Images Fishbone Diagram
- Image Of Fishbone Diagram
- Image Enhancement Dfd Diagram
- Ishikawa Diagram | Draw A Flowchart For Finding The Roots Of ...
- Computer Network Diagrams | Fishbone Diagrams | Venn Diagrams ...
- Fishbone Diagram Example | Draw Fishbone Diagram on MAC ...
- Fishbone Diagram Related To The Business Example Images
- Safety and Security | Food Court | AWS Architecture Diagrams ...
- Bank Audit Diagram Image
- Picture Graphs | Process Flowchart | Bar Graphs | Graph Images In ...
- Swot Analysis Sample Image
- Example Image Of The Diagram Of The Exchange Process Of Market
- ERD | Entity Relationship Diagrams, ERD Software for Mac and Win
- Flowchart | Basic Flowchart Symbols and Meaning
- Flowchart | Flowchart Design - Symbols, Shapes, Stencils and Icons
- Flowchart | Flow Chart Symbols
- Electrical | Electrical Drawing - Wiring and Circuits Schematics
- Flowchart | Common Flowchart Symbols
- Flowchart | Common Flowchart Symbols