What Is a Picture Graph?
What is a Picture Graph? It's one of the most useful way which allows explain the information, statistical data in a visual form using the pictures. ConceptDraw PRO extended with Picture Graphs solution from the Graphs and Charts area offers you the easiest way of Picture Graphs drawing.Chart Maker for Presentations
Easy charting software comes with beautiful chart templates and examples. This makes it easy to create professional charts without prior experience.Process Flowchart
ConceptDraw is Professional business process mapping software for making process flow diagram, workflow diagram, general flowcharts and technical illustrations for business documents. It is includes rich examples, templates, process flowchart symbols. ConceptDraw flowchart maker allows you to easier create a process flowchart. Use a variety of drawing tools, smart connectors, flowchart symbols and shape libraries to create flowcharts of complex processes, process flow diagrams, procedures and information exchange.
HelpDesk
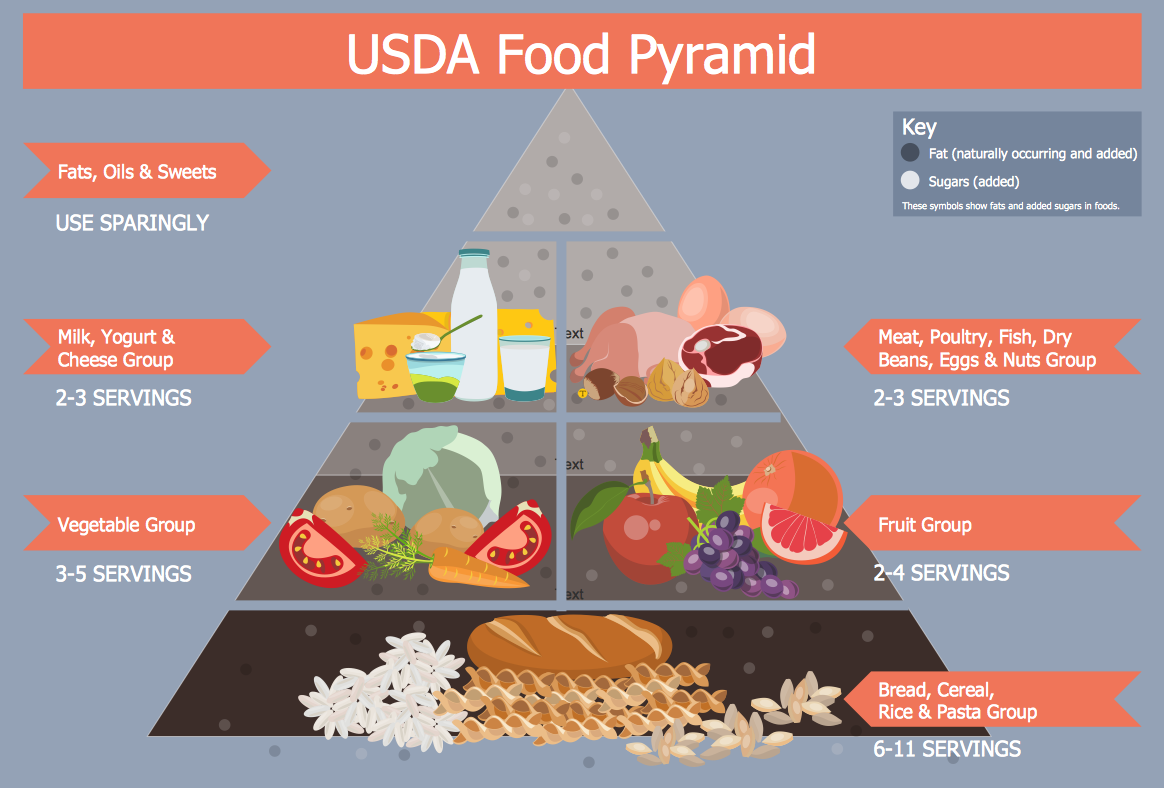
How to Create Infographics that Help People Eat Healthy
The most effective manner of presenting information on healthy diet and food nutrition is using various visualizations such as charts or infographics. To help easily create infographics and diagrams of healthy eating, ConceptDraw has provided the Health Food solution to its Solution Park. It contains vector stencil libraries of healthy eating options, samples of diagrams and infographics, and a set of templates to help you create your own diagrams, infographics and even adds. Using ConceptDraw PRO you can easily create and share healthy food recipes and materials about the proper nutrition.HelpDesk
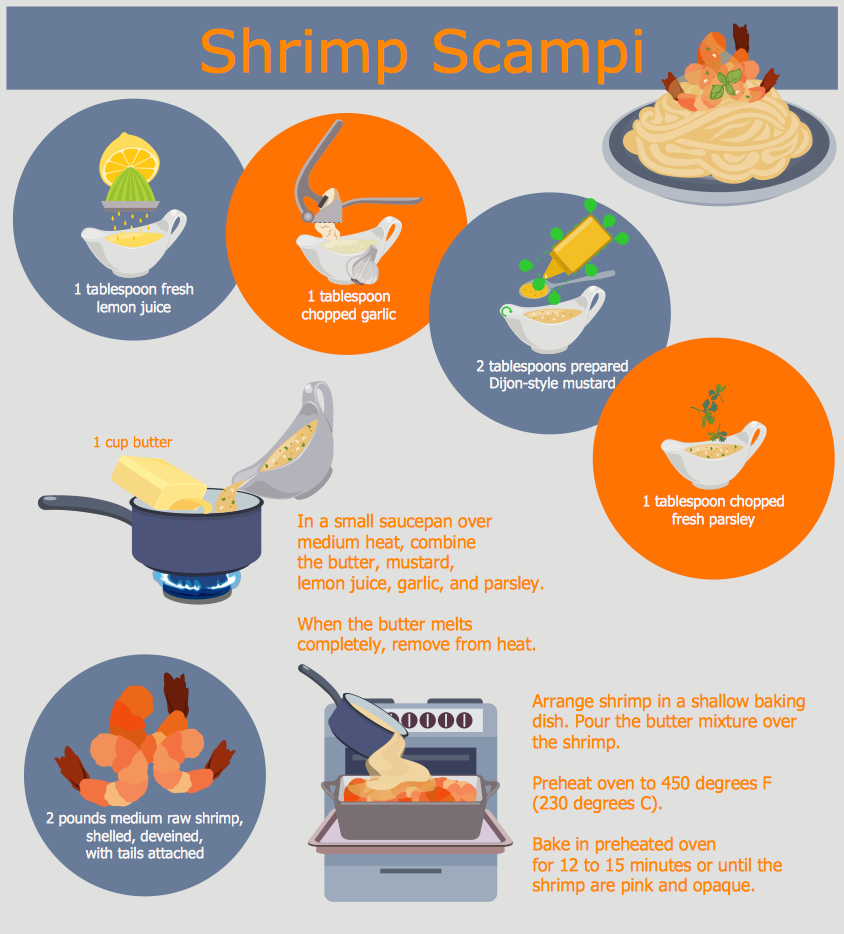
How to Design a Food-related Infographics
Today a large piece of business is referred to a food. This business can not be imagined without various kinds of visualizations. You can see them everywhere — on brand logos, in advertising, on menus and in flyers. Also different food related infographics is used to promote healthy nutrition and to deliver information on how to maintain an effective diet. ConceptDraw Cooking Recipes solution, offers a great collection of bright food-related images and icons, placed into themed libraries. It can be used for catering menu graphics, on marketing flyers, or as concomitant text for infographics.Basic Diagramming
Try ConceptDraw program, the perfect drawing tool for creating all kinds of great-looking drawings, charts, graphs, and illustrations.
Bar Diagrams for Problem Solving. Create economics and financial bar charts with Bar Graphs Solution
Create bar graphs for visualizing economics problem solving and financial data comparison using the ConceptDraw PRO diagramming and vector drawing software extended with the Bar Graphs Solution from the Graphs and Charts area of ConceptDraw Solition Park.Pie Chart Word Template. Pie Chart Examples
The Pie Chart visualizes the data as the proportional parts of a whole and looks like a disk divided into sectors. The pie chart is type of graph, pie chart looks as circle devided into sectors. Pie Charts are widely used in the business, statistics, analytics, mass media. It’s very effective way of displaying relative sizes of parts, the proportion of the whole thing.Business Report Pie. Pie Chart Examples
This sample shows the Business Report Pie Chart. The Pie Chart visualizes the data as the proportional parts of a whole, illustrates the numerical proportion. Pie Charts are very useful in the business, statistics, analytics, mass media.Competitor Analysis
Competitor analysis is a first and obligatory step in elaboration the proper corporate marketing strategy and creating sustainable competitive advantage. Use powerful opportunities of numerous solutions from ConceptDraw Solution Park for designing illustrative diagrams, charts, matrices which are necessary for effective competitor analysis.Pyramid Diagram and Pyramid Chart
Pyramid Diagram is very useful to illustrate the foundation-based relationships. ConceptDraw PRO, a business charting software, includes some build-in symbols for designer to draw all kind of the pyramid diagrams.Visual Presentations Made Easy with Diagramming Software
Automatically create a presentation-quality diagram in one click with ConceptDraw PRO.
Pie Chart Examples and Templates
A pie chart or a circle graph is a circular chart divided into sectors, illustrating numerical proportion. In a pie chart, the arc length of each sector and consequently its central angle and area, is proportional to the quantity it represents.Pie chart examples and templates created using ConceptDraw PRO software helps you get closer with pie charts and find pie chart examples suite your needs.
Chart Software for Better Presentations
Easy charting software comes with beautiful chart templates and examples. This makes it easy to create professional charts without prior experience.Graphs and Charts Area provide a wide collection of professional looking predesigned templates, samples and ready-to-use vector stencils that will help you to draw the charts and diagrams of various types: Pie Charts, Donut Charts, Line Charts, Column Charts, Bar Charts, Pyramids, Scatter Charts, Venn Diagrams, Spider Charts, Area Charts, Divided Bar Graphs.
Venn Diagram Template for Word
This template shows the Venn Diagram. It was created in ConceptDraw PRO diagramming and vector drawing software using the ready-to-use objects from the Venn Diagrams Solution from the "Diagrams" area of ConceptDraw Solution Park.- Picture Graphs | What Is a Picture Graph ? | How to Create a Picture ...
- Sample Pictorial Chart . Sample Infographics | Design elements ...
- Illustrate Graphics Using Pictures __drawings Charts And Graphs
- Illustration Of Graphics Using Pictures Drawing Charts And Graph
- Chart For Nature Picture
- Natures Pics That Can Draw In Chart
- Vector clipart - People | Design elements - Picture graphs ...
- Pictures of Graphs | Picture Graph | The Best Drawing Program for ...
- Design elements - Picture bar graphs | Column Chart Software | Bar ...
- Design elements - Picture graphs
- Scatter Graph Charting Software | Picture Graphs | Business Report ...
- Design elements - Picture bar graphs
- Picture graph - Template
- Basic Flowchart Images . Flowchart Examples | Chart Maker for ...
- In Computer Picture Of Pie Chart Bar Chart Colum Chart Area Chart
- Business Report Pie. Pie Chart Examples | Pie Chart | Create ...
- Picture graphs - Vector stencils library | Management indicators ...
- Design elements - Picture bar graphs | Picture Graph | Pictures of ...
- Design elements - Picture bar graphs | What Is a Picture Graph ...
- Design elements - Picture bar graphs | Bar Chart Examples | Bar ...
- ERD | Entity Relationship Diagrams, ERD Software for Mac and Win
- Flowchart | Basic Flowchart Symbols and Meaning
- Flowchart | Flowchart Design - Symbols, Shapes, Stencils and Icons
- Flowchart | Flow Chart Symbols
- Electrical | Electrical Drawing - Wiring and Circuits Schematics
- Flowchart | Common Flowchart Symbols
- Flowchart | Common Flowchart Symbols


