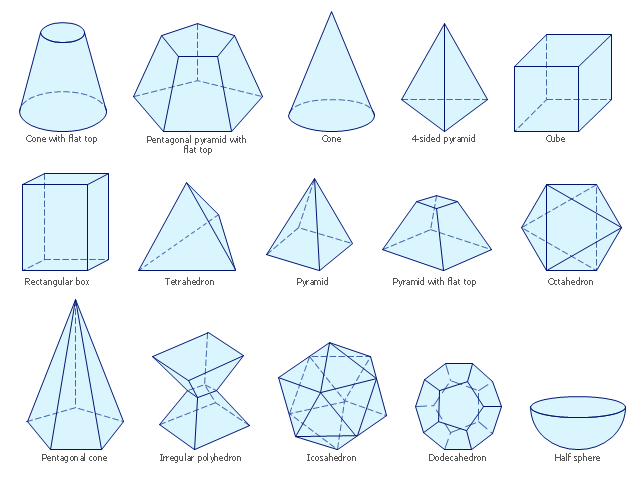
The vector stencils library "Solid geometry" contains 15 shapes of solid geometric figures.
"In mathematics, solid geometry was the traditional name for the geometry of three-dimensional Euclidean space - for practical purposes the kind of space we live in. It was developed following the development of plane geometry. Stereometry deals with the measurements of volumes of various solid figures including cylinder, circular cone, truncated cone, sphere, and prisms.
The Pythagoreans had dealt with the regular solids, but the pyramid, prism, cone and cylinder were not studied until the Platonists. Eudoxus established their measurement, proving the pyramid and cone to have one-third the volume of a prism and cylinder on the same base and of the same height, and was probably the discoverer of a proof that the volume of a sphere is proportional to the cube of its radius." [Solid geometry. Wikipedia]
The shapes example "Design elements - Solid geometry" was created using the ConceptDraw PRO diagramming and vector drawing software extended with the Mathematics solution from the Science and Education area of ConceptDraw Solution Park.
Solid geometrical figures
Cross-Functional Flowchart

Use cross-functional flowcharts to show the relationship between a business process and the functional units (such as departments) responsible for that process. To create it use the best flowchart maker of ConceptDraw PRO.

UML Notation

Two types of diagrams are used in UML: Structure Diagrams and Behavior Diagrams. Behavior Diagrams represent the processes proceeding in a modeled environment. Structure Diagrams represent the elements that compose the system.
How to Draw a Landscape Design Plan

Same as a floor plan, a landscape design represents visually any site using scaled dimensions.
The main purpose of landscape design is to plan the layout for an outdoor area no matter is it a personal site plan for your home or a commercial plan for business. It may also be handful when a new installation, repair or even an outdoor event is planning.
It helps to calculate time and decide which materials should be used in your project. Landscape designs perfectly gives the property owner and landscape contractor better vision for cost estimation, helping to ensure the project time and budget.
Bubble diagrams in Landscape Design with ConceptDraw PRO

 Plant Layout Plans
This solution extends ConceptDraw PRO v.9.5 plant layout software (or later) with process plant layout and piping design samples, templates and libraries of vector stencils for drawing Plant Layout plans. Use it to develop plant layouts, power plant desig
Competitor Analysis

Create Floor Plans Easily with ConceptDraw PRO

Primarily, this basic knowledge of the composition rules. It helps to compose, to place the shapes and volume of the interior, to achieve balance in the room between the free space and objects. This might help to compose correctly, to place the shapes and the volumes in the interior, to achieve balance between free space and furniture in the room.
Basic color theory. There are strictly defined rules and laws, which are used to select a fitting color combinations to create a harmonious interior.

Flowchart Software

ConceptDraw PRO flowchart software will help to quickly create new flowcharts, workflow, NS Diagram, BPMN Diagram, Cross-functional flowcharts, data flow diagrams and highlight flowcharts.
Feature-rich flowchart maker, free thousand flowchart examples and templates and colored symbols that will allow you to create professional looking flowcharts simply.
ConceptDraw PRO supports macOS and Windows.

Football – 2014 FIFA World Cup Standings Group

Site Plan

- Identifying Three Dimensional Figures With Names
- Design elements - Solid geometry | Cube Figures And Names
- Geometrical Figures With Names
- Pyramid Figure
- Design elements - Solid geometry | Names Of Solid Figures Geometry
- Solid Figure And Its Name
- Name Of The Figures
- Same Different Geometric Figures Designs
- Solid Figures Vector
- Geometric Figures Of Kinds Of Solid
- Solid Figure Of Geometry
- Solid Figures
- How to Draw Geometric Shapes in ConceptDraw PRO | Solid ...
- Mathematics Symbols | Scientific Symbols Chart | How to Draw ...
- Design elements - Solid geometry | Mathematics | Solid geometry ...
- Names Of Solids
- Figures Of Pyramid
- Maths Drawing Using Maths Figures
- Solid Name
- Pyramid Geometrical Figures
- ERD | Entity Relationship Diagrams, ERD Software for Mac and Win
- Flowchart | Basic Flowchart Symbols and Meaning
- Flowchart | Flowchart Design - Symbols, Shapes, Stencils and Icons
- Flowchart | Flow Chart Symbols
- Electrical | Electrical Drawing - Wiring and Circuits Schematics
- Flowchart | Common Flowchart Symbols
- Flowchart | Common Flowchart Symbols