Cross-Functional Flowchart

Use cross-functional flowcharts to show the relationship between a business process and the functional units (such as departments) responsible for that process. To create it use the best flowchart maker of ConceptDraw PRO.

Process Flowchart


Basic Flowchart Symbols and Meaning


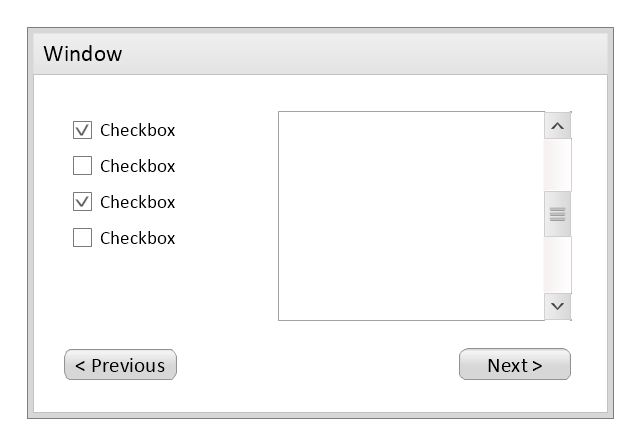
Use this template to prototype and design the wireframe graphic user interface (GUI).
"A website wireframe, also known as a page schematic or screen blueprint, is a visual guide that represents the skeletal framework of a website. Wireframes are created for the purpose of arranging elements to best accomplish a particular purpose. The purpose is usually being informed by a business objective and a creative idea. The wireframe depicts the page layout or arrangement of the website’s content, including interface elements and navigational systems, and how they work together. The wireframe usually lacks typographic style, color, or graphics, since the main focus lies in functionality, behavior, and priority of content. In other words, it focuses on what a screen does, not what it looks like. Wireframes can be pencil drawings or sketches on a whiteboard, or they can be produced by means of a broad array of free or commercial software applications. Wireframes are generally created by business analysts, user experience designers, developers, visual designers and other roles with expertise in interaction design, information architecture and user research.
Wireframes focus on:
(1) The kinds of information displayed.
(2) The range of functions available.
(3) The relative priorities of the information and functions.
(4) The rules for displaying certain kinds of information.
(5) The effect of different scenarios on the display.
The website wireframe connects the underlying conceptual structure, or information architecture, to the surface, or visual design of the website. Wireframes help establish functionality, and the relationships between different screen templates of a website. An iterative process, creating wireframes is an effective way to make rapid prototypes of pages, while measuring the practicality of a design concept. Wireframing typically begins between “high-level structural work - like flowcharts or site maps - and screen designs.” Within the process of building a website, wireframing is where thinking becomes tangible.
Aside from websites, wireframes are utilized for the prototyping of mobile sites, computer applications, or other screen-based products that involve human-computer interaction." [Website wireframe. Wikipedia]
The wireframe GUI template for the ConceptDraw PRO diagramming and vector drawing software is included in the Graphic User Interface solution from the Software Development area of ConceptDraw Solution Park.
Wireframe GUI template
Business Process Flow Diagram

ConceptDraw PRO extended with Business Process Workflow Diagrams solution from the Business Processes area of ConceptDraw Solution Park is a powerful software which lets easy design Business Process Flow Diagram of any complexity.
Optimize a Workflow

Flowchart Programming Project. Flowchart Examples

The programming project flow chart example shows the logical process of execution.
Flowchart Components

HelpDesk
How to Use ConceptDraw Sales Dashboard Solution


 iPhone User Interface
iPhone User Interface solution extends ConceptDraw PRO v10 software with templates, samples and libraries with large quantity of vector stencils of graphical user interface elements, Apps icons, UI patterns for designing and prototyping of the iOS applic
- How To Present Visual Work For Screen Template
- iPhone User Interface | Wireframe GUI - Template | Azure ...
- Wireframe Examples | Wireframe GUI - Template | UML Use Case ...
- Wireframe GUI - Template | Pencil Wireframe
- Wireframe GUI - Template | How to Design an Interface Mock-up of ...
- Website Wireframe | Wireframe GUI - Template | ConceptDraw ...
- Wireframe GUI - Template | Site Plans | Plumbing and Piping Plans ...
- Website Wireframe | Wireframe GUI - Template | Wireframing ...
- Wireframe GUI - Template | Wireframing | Wireframe Tools ...
- Wireframe GUI - Template | DroidDia prime | ConceptDraw Solution ...
- ERD | Entity Relationship Diagrams, ERD Software for Mac and Win
- Flowchart | Basic Flowchart Symbols and Meaning
- Flowchart | Flowchart Design - Symbols, Shapes, Stencils and Icons
- Flowchart | Flow Chart Symbols
- Electrical | Electrical Drawing - Wiring and Circuits Schematics
- Flowchart | Common Flowchart Symbols
- Flowchart | Common Flowchart Symbols