Process Flowchart
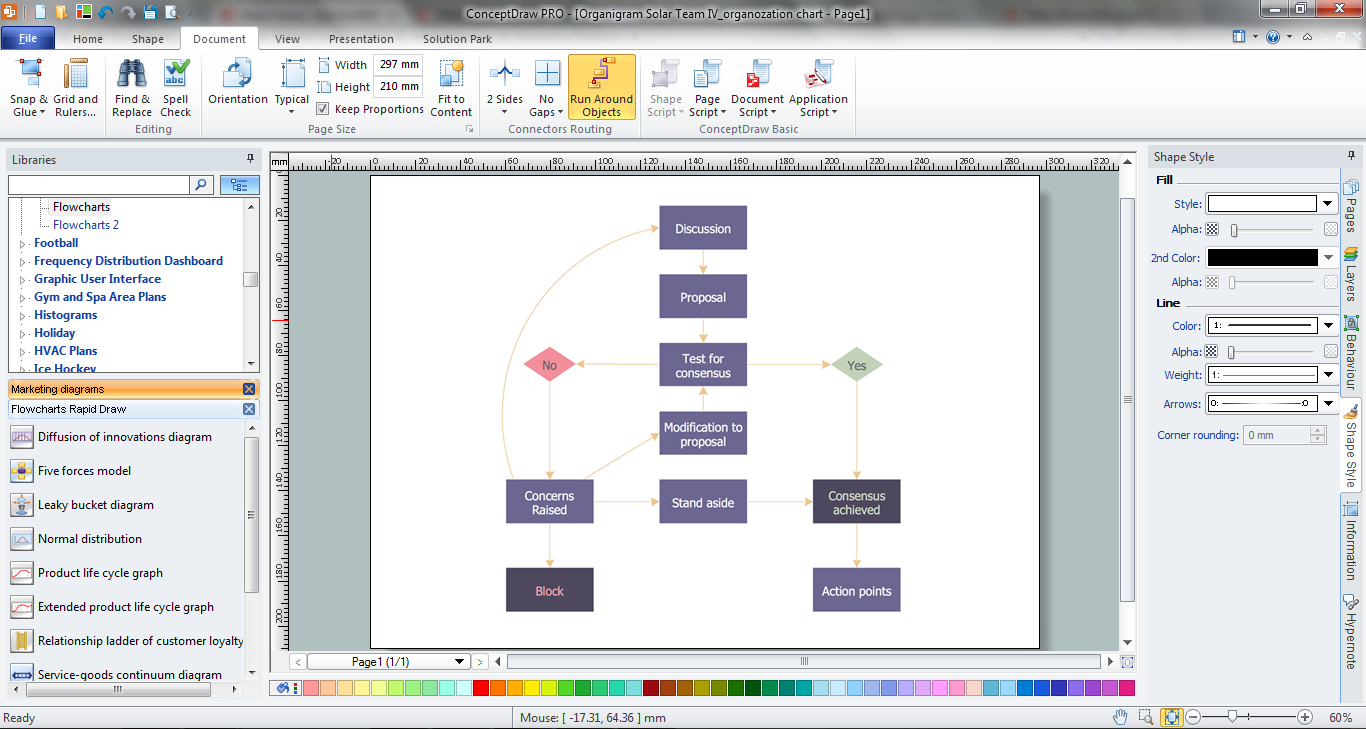
ConceptDraw is Professional business process mapping software for making process flow diagram, workflow diagram, general flowcharts and technical illustrations for business documents. It is includes rich examples, templates, process flowchart symbols. ConceptDraw flowchart maker allows you to easier create a process flowchart. Use a variety of drawing tools, smart connectors, flowchart symbols and shape libraries to create flowcharts of complex processes, process flow diagrams, procedures and information exchange.
Competitor Analysis
Competitor analysis is a first and obligatory step in elaboration the proper corporate marketing strategy and creating sustainable competitive advantage. Use powerful opportunities of numerous solutions from ConceptDraw Solution Park for designing illustrative diagrams, charts, matrices which are necessary for effective competitor analysis.Marketing Flow Chart
ConceptDraw PRO diagramming and vector drawing software extended with Marketing Diagrams Solution from the Marketing Area of ConceptDraw Solution Park is the best software for quick and easy creating Marketing Flow Chart of any complexity and design.Best Mind Mapping Program for Making Presentations
ConceptDraw MINDMAP with the ability to import presentations from Microsoft PowerPoint, as well as enhancing its existing presentation capabilities.HelpDesk
How to Create a Bar Chart in ConceptDraw PRO
Bar charts (bar graphs) are diagrams displaying data as horizontal or vertical bars of certain heights.Bar charts are widely used to show and compare the values of the same parameters for different data groups.
The bar graph can be vertical or horizontal. This depends on the amount of categories. There are many methods in which bar graph can be built and this makes it a very often used chart type. Usually, a bar chart is created so that the bars are placed vertically. Such arrangement means that the bar's height value is proportional to the category value. Nevertheless, a bar chart can be also drawn horizontally. This means that the longer the bar, the bigger the category. Thus, a bar chart is a good way to present the relative values of different measured items. The ConceptDraw Bar Graphs solution allows you to draw a bar chart quickly using a vector library, containing the set of various bar charts objects.
Sales Process Map
You need create a Sales Process Map? Use the ConceptDraw PRO software which is ideal for the sales process management, marketing and engineering thanks to the powerful Sales Flowcharts solution from the Marketing area of ConceptDraw Solution Park.
 Telecommunication Network Diagrams
Telecommunication Network Diagrams solution extends ConceptDraw PRO software with samples, templates, and great collection of vector stencils to help the specialists in a field of networks and telecommunications, as well as other users to create Computer systems networking and Telecommunication network diagrams for various fields, to organize the work of call centers, to design the GPRS networks and GPS navigational systems, mobile, satellite and hybrid communication networks, to construct the mobile TV networks and wireless broadband networks.
Cross-Functional Flowchart
Cross-Functional Flowchart - to draw cross functional process maps is by starting with a cross-functional flowchart samples and templates. Easy to draw sample cross functional Process Flow Diagrams. Using a Cross-Functional flowchart is a clear way of showing each team member’s responsibilities and how processes get shared or transferred between different teams and departments.Use cross-functional flowcharts to show the relationship between a business process and the functional units (such as departments) responsible for that process. To create it use the best flowchart maker of ConceptDraw PRO.

Contoh Flowchart
A Flowchart is a graphical representation of the algorithm, process or the step-by-step solution of the problem. There are ten various types of Flowcharts. The ConceptDraw allows you to draw the flowchart of any type.The Contoh Flowchart included to Flowcharts solution are professional looking practical samples and you can quick and easy modify them, print, or publish on web.
HelpDesk
How to Create Education Infographics
Education Infographics is used to display a lot of education-related information in a single, visually-appealing graphic. Infographics, created for education purposes can contain different illustrations, detailed charts, and data. ConceptDraw PRO can be used as a tool for creating education infographics. It allows you to draw infographics quickly and easily using the special templates and vector stencils libraries. Infographics can be used to quickly communicate a message, to simplify the presentation of large amounts of data, to see data patterns and relationships, and to monitor changes in variables over time. It can contain bar graphs, pie charts, histograms, line charts, e.t.c.
 Scatter Diagrams
The Scatter Diagrams solution extends ConceptDraw PRO v10 functionality with templates, samples, and a library of vector stencils that make construction of a Scatter Plot easy. The Scatter Chart Solution makes it easy to design attractive Scatter Diagrams used in various fields of science, work, and life activities. ConceptDraw PRO lets you enter the data to the table and construct the Scatter Plot Graph automatically according to these data.
 Management Area
The solutions from Management area of ConceptDraw Solution Park collect templates, samples and libraries of vector stencils for drawing the management diagrams and mind maps.
 Remote Presentation for Skype
This solution extends ConceptDraw MINDMAP software with the ability to collaborate via Skype.
- Sales Growth. Bar Graphs Example
- Bar chart - Template | Bar Graph | How to Create a Sales Dashboard ...
- Bar Graphs | Sales Growth. Bar Graphs Example | Line Graphs ...
- Sales Growth. Bar Graphs Example | Bar Graphs | Bar Graph ...
- Sales Growth. Bar Graphs Example | Bar Chart Examples | Create ...
- Waterfall Bar Chart | Sales Growth. Bar Graphs Example | Export ...
- Double bar graph - Template | Sales Growth. Bar Graphs Example ...
- Best Graph To Present Population
- Sales Growth. Bar Graphs Example | Bar Graph | Chart Maker for ...
- Sales Growth. Bar Graphs Example | Financial Comparison Chart ...
- Sales Growth. Bar Graphs Example | TQM Diagram Example ...
- Sales Growth. Bar Graphs Example | Bar Chart Examples | Bar ...
- Bar Chart Template
- Sales Growth. Bar Graphs Example | How To Create Restaurant ...
- Histogram Chart | Making a Histogram | Histogram | Bar Graph Vs ...
- TQM Diagram Example | Sales Growth. Bar Graphs Example | Ansoff ...
- Divided Bar Diagrams | Bar Graphs | Bar Chart Template for Word ...
- Bar Graph | Bar Chart Software | Sales Growth. Bar Graphs Example ...
- Bar Chart Examples | Bar Graphs | Sales Growth. Bar Graphs ...
- Bar Graphs | Sales Growth. Bar Graphs Example | Bar Graph | Bar ...
- ERD | Entity Relationship Diagrams, ERD Software for Mac and Win
- Flowchart | Basic Flowchart Symbols and Meaning
- Flowchart | Flowchart Design - Symbols, Shapes, Stencils and Icons
- Flowchart | Flow Chart Symbols
- Electrical | Electrical Drawing - Wiring and Circuits Schematics
- Flowchart | Common Flowchart Symbols
- Flowchart | Common Flowchart Symbols


