HelpDesk
How to Add a Block Diagram to an MS Word ™ Document
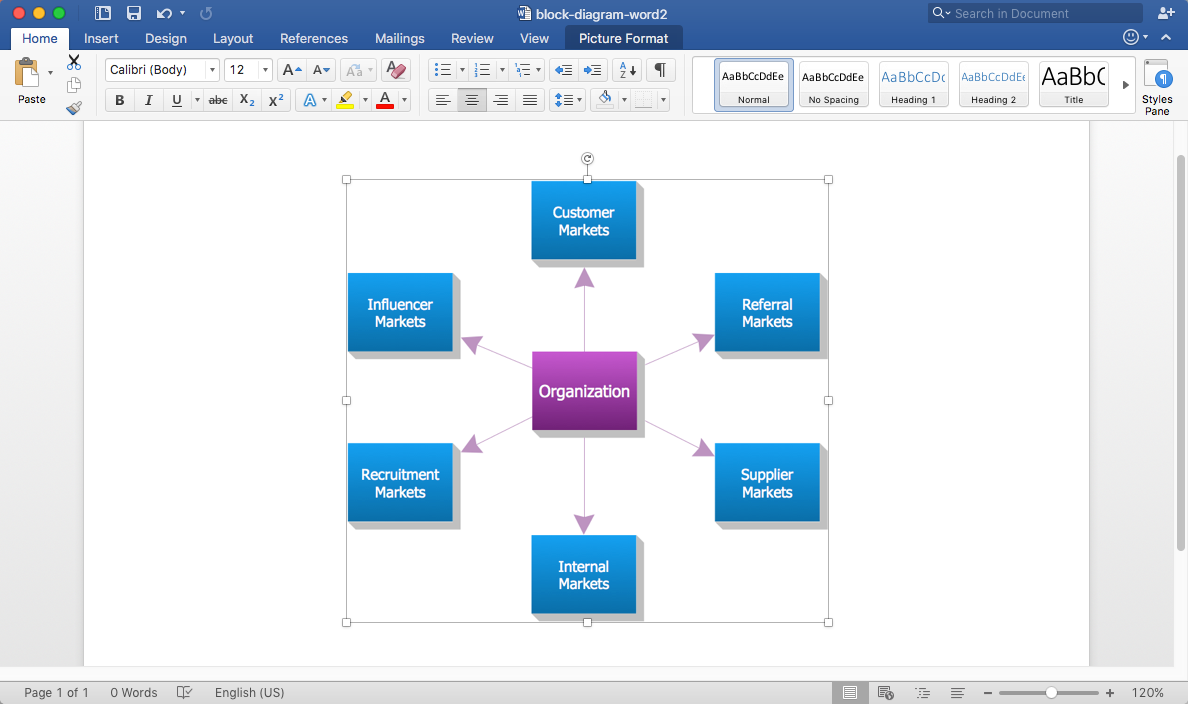
Functional Flow Block Diagram

HelpDesk
How to Add a Network Diagram to MS Word
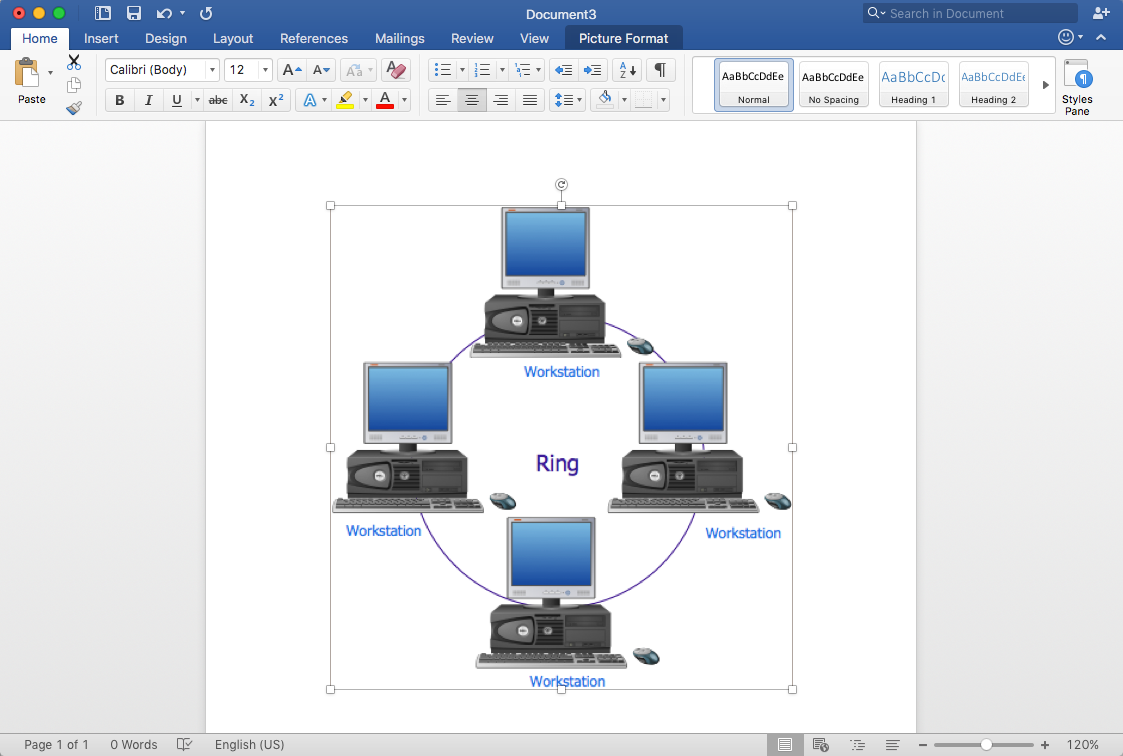
Process Flowchart


HelpDesk
How to Draw a Block Diagram

 Block Diagrams
Block diagrams solution extends ConceptDraw DIAGRAM software with templates, samples and libraries of vector stencils for drawing the block diagrams.
Block Diagram

Use the libraries from the Block Diagrams solution to draw block diagrams for your business documents, presentations and websites in a few minutes.
Draw Fishbone Diagram on MAC Software

Professional diagramming ConceptDraw DIAGRAM MAC OSX software with Fishbone Diagrams solution helps you make cause and effect analysis, identify the possible causes for an effect for problem solving, draw Fishbone diagram on Mac software aka Ishikawa diagram from brainstorm, templates and examples.
Basic Diagramming

Use Basic Diagramming solution to draw you own diagrams, charts and graphs for graphic communication, explanation of business and personal ideas and concepts, simple visual presentation of numerical data, complex structures, logical relations, step-by-step flows of actions or operations.

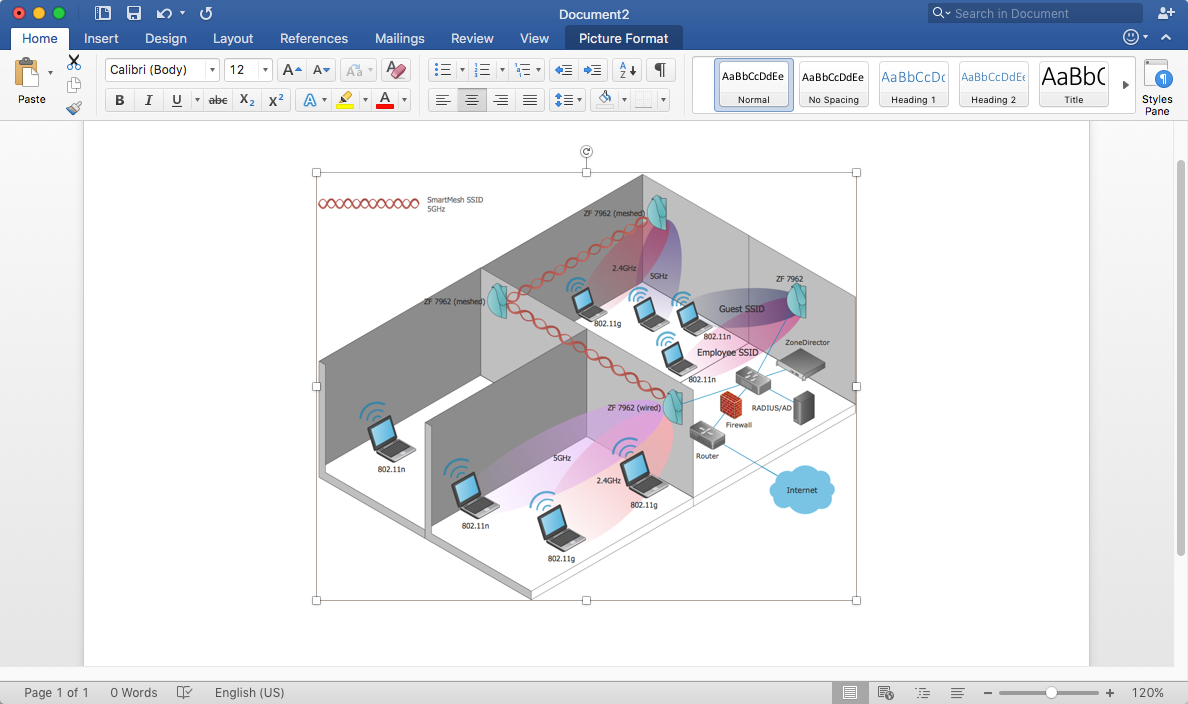
HelpDesk
How to Add a Wireless Network Diagram to MS Word Document
- How To Draw Block Diagram In Word
- How To Draw Use Case Diagram In Word
- How To Draw Block Diagram In Microsoft Powerpoint
- How To Draw Block Diagram In Word Document
- How to Add a Block Diagram to a MS Word ™ Document Using ...
- How to Add a Block Diagram to a MS Word ™ Document Using ...
- How To Make Block Diagram In Word
- How To Draw Block Diagram For Feedback Loop In Microsoft Office
- How To Draw A Cycle Diagram In Word
- How to Create a Functional Flow Block Diagram | SysML block ...
- ERD | Entity Relationship Diagrams, ERD Software for Mac and Win
- Flowchart | Basic Flowchart Symbols and Meaning
- Flowchart | Flowchart Design - Symbols, Shapes, Stencils and Icons
- Flowchart | Flow Chart Symbols
- Electrical | Electrical Drawing - Wiring and Circuits Schematics
- Flowchart | Common Flowchart Symbols
- Flowchart | Common Flowchart Symbols