The cycle diagram sample was created on the base of the figure illustrating the webpage "2. POLICY & STRATEGY" of "Scottish Police College Primary Inspection 2006: A Report by Her Majesty's Inspectorate of Constabulary" from the Scottish Government website.
"Strategic Planning.
2.1 The planning process for the College currently follows a structured approach, starting in April and extending through the financial year. The planning cycle is illustrated in figure 2. ...
2.2 The College recognises the need to consult with its customers and stakeholders in the process of setting objectives and directing the training programme. The planning cycle to date refers to force visits, environmental scanning, the course planning process which involves consultation with all forces and other common police services, as well as to a survey of external providers.
2.3 The information from consultation feeds into an EFQM framework from which the College has identified four key policies, namely:
(1) developing and delivering quality training;
(2) developing our people through lifelong learning;
(3) continuous improvement of our service; and
(4) embracing the changing environment.
2.4 The objectives set at divisional level are designed to contribute to delivering these policies. HMIC found that whilst the selected objectives were presented in line with the structure, not all could be considered to meet SMART (Specific, Measurable, Achievable, Relevant and Timed) criteria. This failure indicates that while the process appears suitably structured to deliver a robust result, some of those involved could perhaps have a better understanding of the process." [scotland.gov.uk/ Publications/ 2007/ 02/ 15134652/ 8]
The cycle diagram example "Strategic planning" was created using the ConceptDraw PRO diagramming and vector drawing software extended with the Target and Circular Diagrams solution from the Marketing area of ConceptDraw Solution Park.
www.conceptdraw.com/ solution-park/ marketing-target-and-circular-diagrams
Cycle diagram

Flowchart Example: Flow Chart of Marketing Analysis

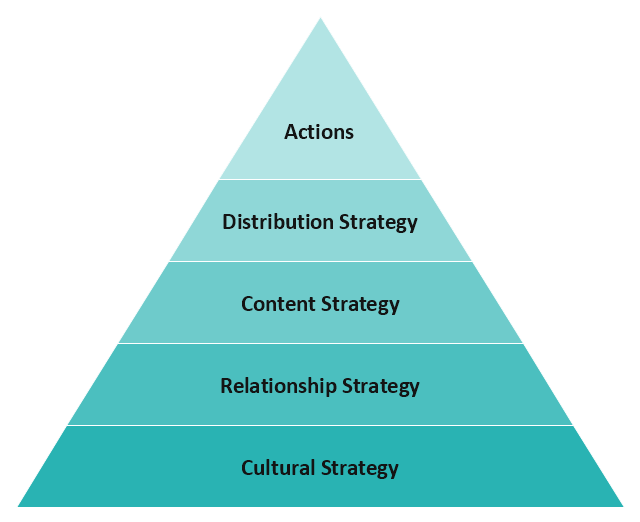
This social strategy pyramid diagram example has 5 levels: Actions, Distribution strategy, Content strategy, Relashionship strategy, Cultural strategy.
"Social marketing seeks to develop and integrate marketing concepts with other approaches to influence behaviors that benefit individuals and communities for the greater social good. It seeks to integrate research, best practice, theory, audience and partnership insight, to inform the delivery of competition sensitive and segmented social change programs that are effective, efficient, equitable and sustainable.
Although "social marketing" is sometimes seen only as using standard commercial marketing practices to achieve non-commercial goals, this is an oversimplification. The primary aim of social marketing is "social good", while in "commercial marketing" the aim is primarily "financial". This does not mean that commercial marketers can not contribute to achievement of social good.
Increasingly, social marketing is being described as having "two parents" - a "social parent", including social science and social policy approaches, and a "marketing parent", including commercial and public sector marketing approaches." [Social marketing. Wikipedia]
This triangular scheme sample "Social strategy" was created using the ConceptDraw PRO diagramming and vector drawing software extended with the Pyramid Diagrams solution from the Marketing area of ConceptDraw Solution Park.
Pyramid diagram
SDL Diagram

This sample shows the SDL Diagram of the process game.
BPR Diagram. Business Process Reengineering Example

Audit Process Flowchart. Audit Flowchart

Fundraising Pyramid

TOWS Matrix

Pyramid Diagram

3D triangular diagram of DIKW pyramid has 6 levels: measurement, facts, data, information, knowledge, wisdom.
The data component include different scattered signs or symbols which are merely useless until these random objective facts are somehow processed. Data is a resource which has to be manipulated or rearranged to get useful. Information can be extracted from a pile of data, it also can be mined from different data storages.
Database Flowchart Symbols

ConceptDraw Software provides number of data-base chart libraries including major 49 vector symbols. Use these DFD flowchart symbol libraries to design data-base structure and models, use it to design data base process-oriented models, or simple data-oriented models. The are special drawing tools for making data flowcharts, data process diagrams, structured analysis diagrams, and information flow diagrams.
Fishbone Diagram Problem Solving

To design easily the Fishbone diagram, you can use a special ConceptDraw DIAGRAM vector graphic and diagramming software which contains the powerful tools for Fishbone diagram problem solving offered by Fishbone Diagrams solution for the Management area of ConceptDraw Solution Park.
Organizational Structure Types

ConceptDraw DIAGRAM diagramming and vector drawing software enhanced with 25 Typical Orgcharts solution from the Management area of ConceptDraw Solution Park is ideal for designing diagrams and charts of any organizational structure types.
Fishbone Problem Solving

ConceptDraw DIAGRAM diagramming and vector drawing software extended with Fishbone Diagrams Solution from the Management Area of ConceptDraw Solution Park is a powerful Fishbone Problem Solving tool.
Business and Finance Illustrations

The Business and Finance solution contains 12 vector clipart libraries: Advertising, Business, Business people clipart, Business people figures, Currency, Mail and post, Management, Marketing, Money, Office, Project management, Time
Marketing and Sales Organization chart. Organization chart Example

This sample shows the Organizational Chart that displays the Sales and marketing (CRM) module. Using the ready-to-use predesigned objects, samples and templates from the Organizational Charts Solution for ConceptDraw DIAGRAM you can create your own orgchart professional quick and easy.
 MindTweet
This solution extends ConceptDraw MINDMAP software with the ability to brainstorm, review and organize the sending of Tweets.
Produce Professional Diagrams More Quickly, Easily and Cost Effectively

Professional diagramming software for mac helps you create variety diagrams, graphics, charts, live dashboards and plenty of graphics and pictures for your business and study.
Organizational Charts with ConceptDraw DIAGRAM

 Fishbone Diagrams
The Fishbone Diagrams solution extends ConceptDraw DIAGRAM software with the ability to easily draw the Fishbone Diagrams (Ishikawa Diagrams) to clearly see the cause and effect analysis and also problem solving. The vector graphic diagrams produced using this solution can be used in whitepapers, presentations, datasheets, posters, and published technical material.
- Social strategy - Pyramid diagram | Process Flowchart | Ice Hockey ...
- CCTV Network Example | How To Create CCTV Network Diagram ...
- Soccer (Football) Positions | Soccer (Football) Formation | Offensive ...
- Fishbone Diagrams | Stakeholder Onion Diagrams | Block diagram ...
- CCTV Network Example | CCTV Network Diagram Software | Entity ...
- CCTV Network Example | CCTV Network Diagram Software | How ...
- Security and Access Plans | How to Create a CCTV Diagram in ...
- Video surveillance scheme - School floor plan | How To Create ...
- Entity Relationship Diagram Symbols | Martin ERD Diagram ...
- CCTV Network Example | How To Create CCTV Network Diagram ...
- Security and Access Plans | CCTV Network Diagram Software | How ...
- Pyramid Diagram | Pyramid Diagram | Types of Flowcharts | Phrymid ...
- Puzzle piece diagram - Alternating sign matrix | Porter's generic ...
- Fishbone Diagram Problem Solving | Human Resource ...
- Design elements - UML class diagrams | Bubble Diagrams | Pyramid ...
- SWOT and TOWS Matrix Diagrams | Chemical Engineering | SWOT ...
- Exporting maps as graphics or to other applications from ...
- UML sequence diagram - GET request | Rapid UML | Timeline ...
- Basketball Court Diagram and Basketball Positions | Basketball ...
- Engineering | Technical Drawing Software | FSM — Finite- state ...
- ERD | Entity Relationship Diagrams, ERD Software for Mac and Win
- Flowchart | Basic Flowchart Symbols and Meaning
- Flowchart | Flowchart Design - Symbols, Shapes, Stencils and Icons
- Flowchart | Flow Chart Symbols
- Electrical | Electrical Drawing - Wiring and Circuits Schematics
- Flowchart | Common Flowchart Symbols
- Flowchart | Common Flowchart Symbols