Basic Diagramming


Process Flowchart


The vector stencils library "Picture Graphs" contains 35 templates of picture bar graphs for visual data comparison and time series.
Drag a template from the library to your document, set bars number, type category labels, select bars and enter your data.
Use these shapes to draw your pictorial bar charts in the ConceptDraw PRO diagramming and vector drawing software.
The vector stencils library "Picture Graphs" is included in the Picture Graphs solution from the Graphs and Charts area of ConceptDraw Solution Park.
Arrow
Water drop

Food

Grain

Agriculture

Medicines

Houses

Buildings

Money bags

Oil barrels

Natural gas

Electrical power

Nuclear power

Mechanical engineering

Chemical industry

Mining

Gold bars

Coins

Person

Men, women and children

Man

Woman

Child

Milk

Meat

Fruits

Vegetables

Computer

Mobile phone

Airliner

Car

Bus

Truck

Train

Cargo ship

Basic Flowchart Symbols and Meaning


The vector stencils library "Picture bar graphs" contains 35 templates of pictorial charts. Use it for visualization of data comparison and time series with ConceptDraw PRO diagramming and vector drawing software.
"Pictorial bar graph.
Sometimes reffered to as a pictographs. A pictorial bar graph is a graph in which the rectangular bars have been filled with pictures, sketches, icons, etc. or where pictures, sketches, icons, etc. have been substituted for the rectangular bars. In both variations, one or more symbols might be used in each bar. The two major reasons for using pictorial graphs are to make the graph more appealing visually and to facilitate better communications." [Information Graphics: A Comprehensive Illustrated Reference. R. L. Harris. 1999. p.41]
The pictorial charts example "Design elements - Picture bar graphs" is included in the Picture Graphs solution from the Graphs and Charts area of ConceptDraw Solution Park.
Templates

Infographic Maker

HelpDesk
How to Create a Picture Graph

How tо Represent Information Graphically

 Line Graphs
How to draw a Line Graph with ease? The Line Graphs solution extends the capabilities of ConceptDraw PRO v10 with professionally designed templates, samples, and a library of vector stencils for drawing perfect Line Graphs.
 Picture Graphs
Typically, a Picture Graph has very broad usage. They many times used successfully in marketing, management, and manufacturing. The Picture Graphs Solution extends the capabilities of ConceptDraw PRO v10 with templates, samples, and a library of professionally developed vector stencils for designing Picture Graphs.
Picture Graph

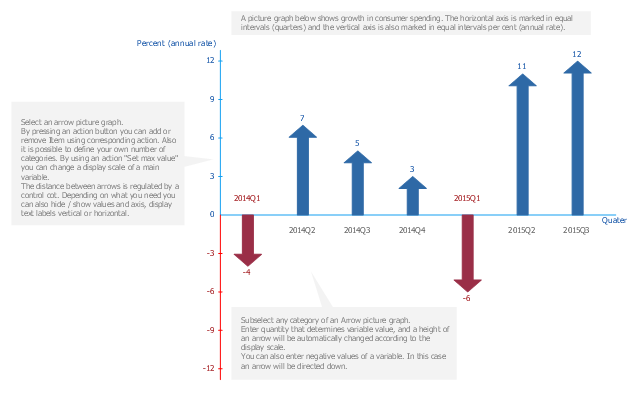
A picture chart (image chart, pictorial graph) is the type of a bar graph visualizing numarical data using symbols and pictograms.
In the field of economics and finance use a picture graph with columns in the form of coins. For population comparison statistics use a chart with columns in the form of manikins. To show data increase or decrease use arrows bar charts.
The arrow chart template "Picture graph" for the ConceptDraw PRO diagramming and vector drawing software is included in the Basic Picture Graphs solution from the Graphs and Charts area of ConceptDraw Solution Park.
Arrows bar graph template
Bar Diagrams for Problem Solving. Create economics and financial bar charts with Bar Graphs Solution

HelpDesk
How to Create Data-driven Infographics

Tools to Create Your Own Infographics

- How to Draw a Pictorial Chart in ConceptDraw PRO | How to Draw ...
- How To Draw Pictorial Graphs For Data
- Sample Pictorial Chart . Sample Infographics | Basic Diagramming ...
- Picture Graphs | Picture Graph | How to Create a Picture Graph in ...
- Sample Pictorial Chart . Sample Infographics | How to Draw Pictorial ...
- How to Draw a Pictorial Chart in ConceptDraw PRO
- Bar Graphs | Picture Graphs | Sales Growth. Bar Graphs Example ...
- Basic Diagramming | How to Draw Pictorial Chart . How to Use ...
- Sample Pictorial Chart . Sample Infographics | How to Draw a ...
- Pictorial Bar Graph
- How to Draw Pictorial Chart . How to Use Infograms | How to Draw a ...
- Pie Graph Worksheets | How to Draw a Pictorial Chart in ...
- Pictorial Graph Example
- Sample Pictorial Chart . Sample Infographics | Pictorial Chart | How ...
- How to Draw a Pictorial Chart in ConceptDraw PRO | Sample ...
- How to Draw Pictorial Chart . How to Use Infograms | Sample ...
- Example Of Pictorial Graph
- How To Draw A Pictorialgraph
- How to Draw a Pictorial Chart in ConceptDraw PRO | Process ...
- Pictorial Graph
- ERD | Entity Relationship Diagrams, ERD Software for Mac and Win
- Flowchart | Basic Flowchart Symbols and Meaning
- Flowchart | Flowchart Design - Symbols, Shapes, Stencils and Icons
- Flowchart | Flow Chart Symbols
- Electrical | Electrical Drawing - Wiring and Circuits Schematics
- Flowchart | Common Flowchart Symbols
- Flowchart | Common Flowchart Symbols