HelpDesk
How to Add a Bubble Diagram to PowerPoint Presentation
Bubble diagrams can be used to compare concepts and identify areas of similarity and difference. ConceptDraw DIAGRAM allows you to make an MS PowerPoint Presentation from your charts in a few simple steps. A bubble diagram is a chart that represents information visually in the form of a series of bubbles. Bubble charts are often used in marketing and management during the early stages of product development to visualize ideas and concepts by organizing them in a hierarchy. The ability to create this form of a diagram is contained within the Bubble Diagrams solution. A PowerPoint presentation of bubble diagrams can be used to demonstrate and identify areas of similarity and difference of featured business ideas and concepts.HelpDesk
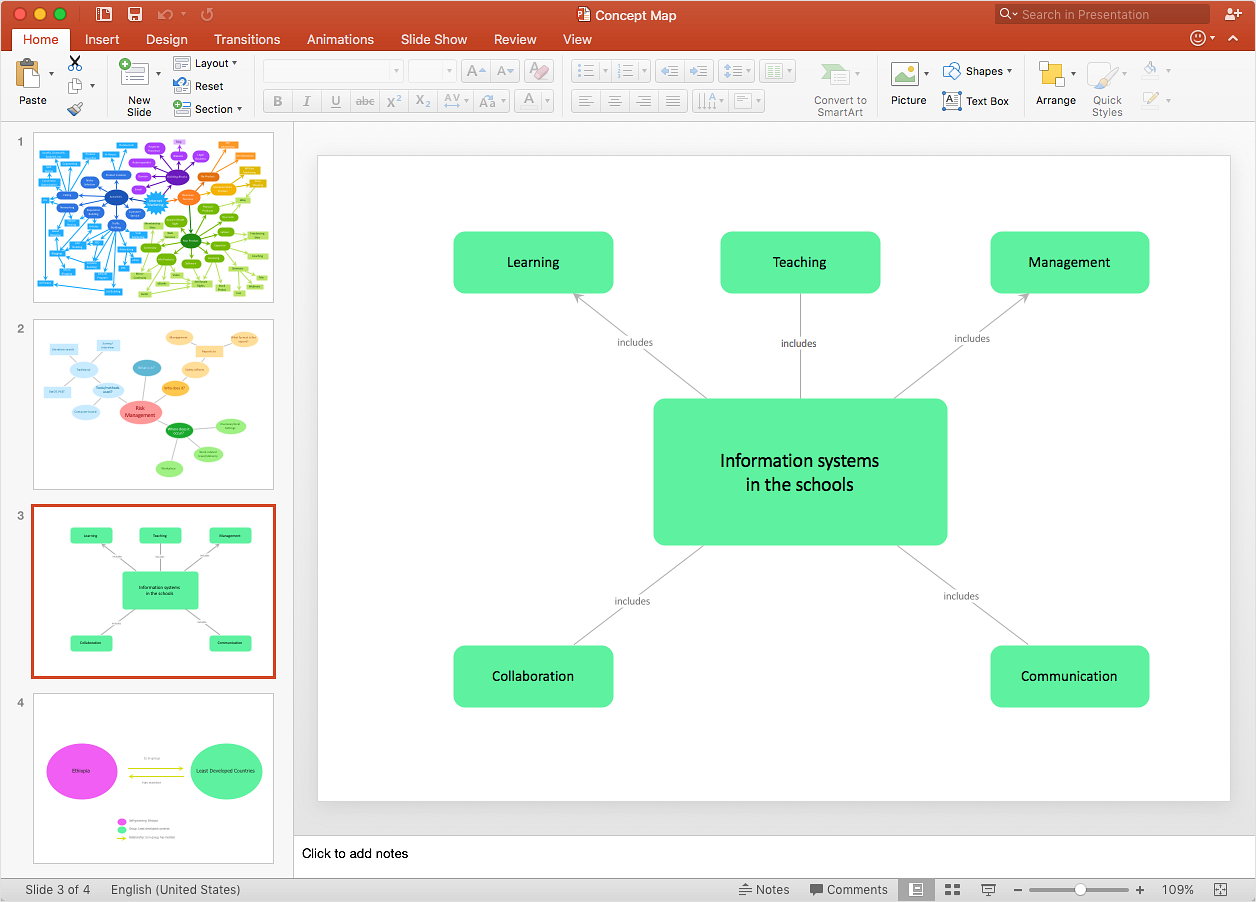
How to Add a Concept Map to a PowerPoint Presentation
Concept maps visually present the relationships among a set of logically connected items. ConceptDraw DIAGRAM allows you to draw concept maps using the Concept Map solution. The PowerPoint presentation of key concept points can be very informative and helpful.ConceptDraw DIAGRAM Compatibility with MS Visio
For those who are migrating from MS Visio to ConceptDraw DIAGRAM, or for those who have colleagues and clients who use Visio, ConceptDraw DIAGRAM is compatible with MS Visio.VSDX formatted files.VSDX is Visio’s open XML file format, and it can be easily imported and exported by ConceptDraw DIAGRAM.
 Entity-Relationship Diagram (ERD)
Entity-Relationship Diagram (ERD) solution extends ConceptDraw DIAGRAM software with templates, samples and libraries of vector stencils from drawing the ER-diagrams by Chen's and crow’s foot notations.
- Er Diagram Symbols Ppt
- How to Add a Bubble Diagram to a PowerPoint Presentation Using ...
- How To Draw Er Diagram In Ms Powerpoint
- Entity Relationship Diagram - ERD - Software for Design Crows Foot ...
- How to Add a Bubble Diagram to a PowerPoint Presentation Using ...
- Database Diagram Powerpoint
- Free Database Diagram Tools Powerpoint
- How to Add a Bubble Diagram to a PowerPoint Presentation Using ...
- How To Use A Microsoft Powerpoint Presentation Er Diagram Pdf
- Easy Ppt On Er Diagram
- Fishbone Diagram | Presentation Exchange | Entity-Relationship ...
- Er Diagram Examples Ppt
- Erd Diagram Examples With Solution Ppt
- Entity-Relationship Diagram
- Free Powerpoint Diagram
- Er Tools Basic Ppt Presentation
- Computer Network Diagrams | Network Diagramming with ...
- Er Diagram Of Atm Ppt
- Uml Diagrams For Example Any Dabase Ppt Pdf
- How To Make a PowerPoint Presentation of a Floor Plan Using ...
- ERD | Entity Relationship Diagrams, ERD Software for Mac and Win
- Flowchart | Basic Flowchart Symbols and Meaning
- Flowchart | Flowchart Design - Symbols, Shapes, Stencils and Icons
- Flowchart | Flow Chart Symbols
- Electrical | Electrical Drawing - Wiring and Circuits Schematics
- Flowchart | Common Flowchart Symbols
- Flowchart | Common Flowchart Symbols


