 Venn Diagrams
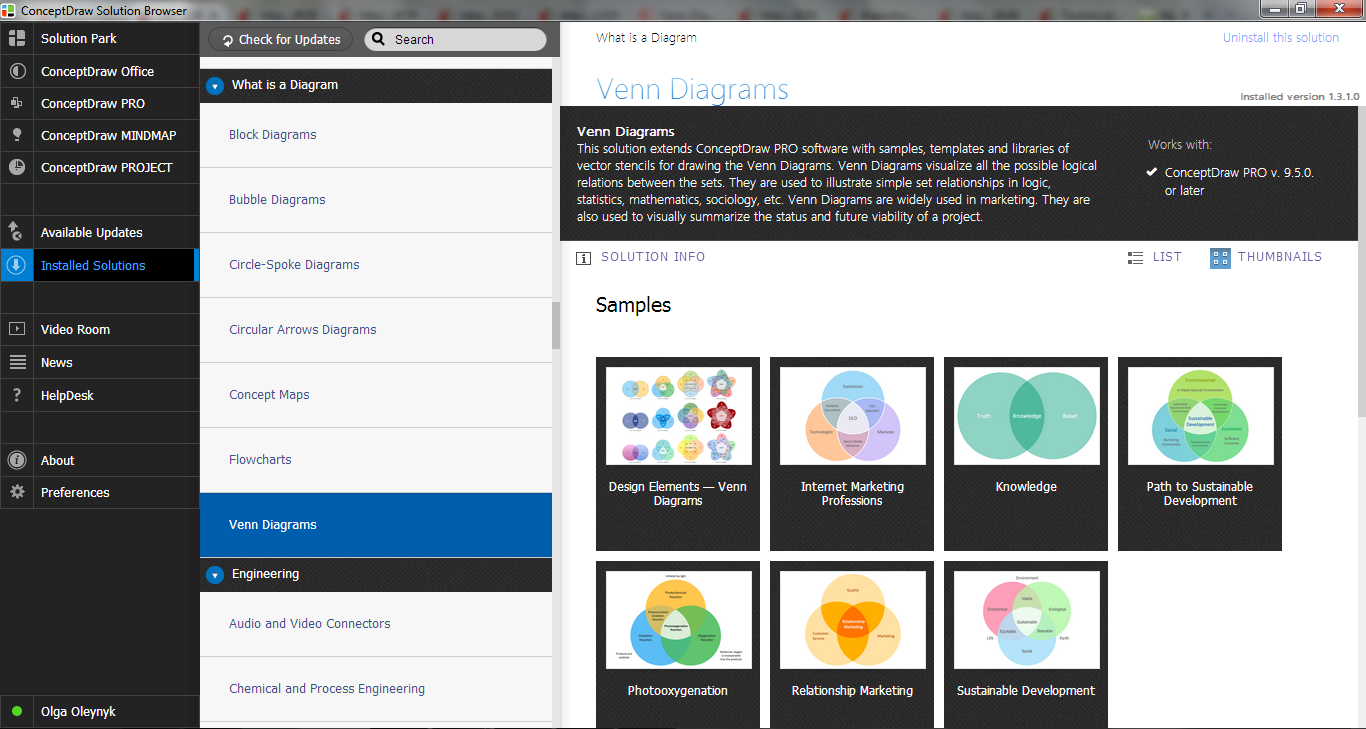
Venn Diagrams are actively used to illustrate simple set relationships in set theory and probability theory, logic and statistics, mathematics and computer science, linguistics, sociology, and marketing. Venn Diagrams are also often used to visually summarize the status and future viability of a project.
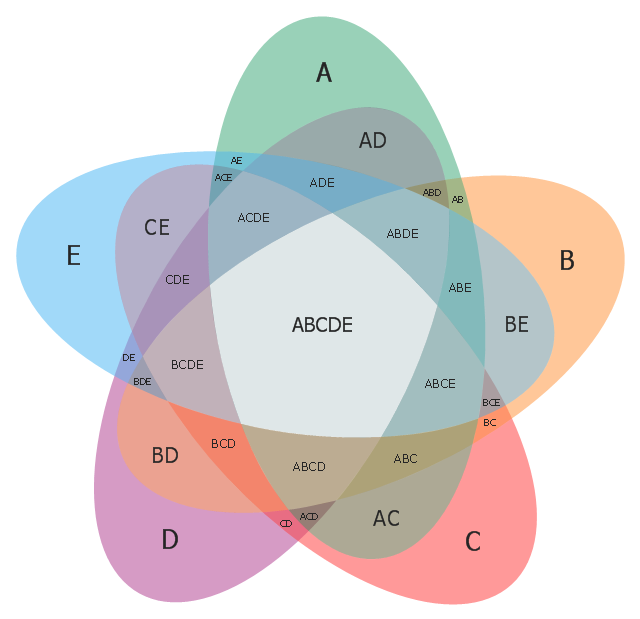
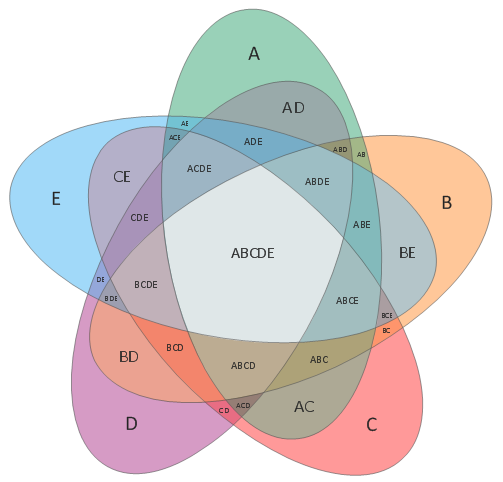
Use this template to design your five set Venn diagrams.
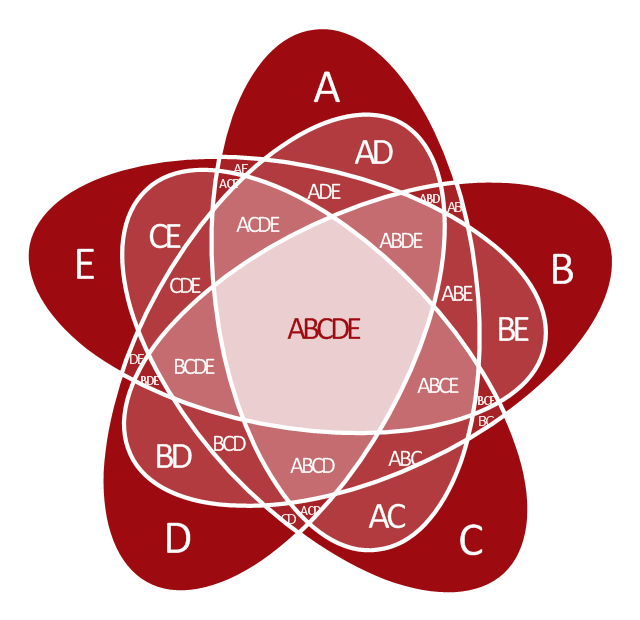
"Five-set Venn diagram using congruent ellipses in a radially symmetrical arrangement devised by Branko Grünbaum. Labels have been simplified for greater readability." [Venn diagram. Wikipedia]
The template "5-set Venn diagram" for the ConceptDraw PRO diagramming and vector drawing software is included in the Venn Diagrams solution from the area "What is a Diagram" of ConceptDraw Solution Park.
Template
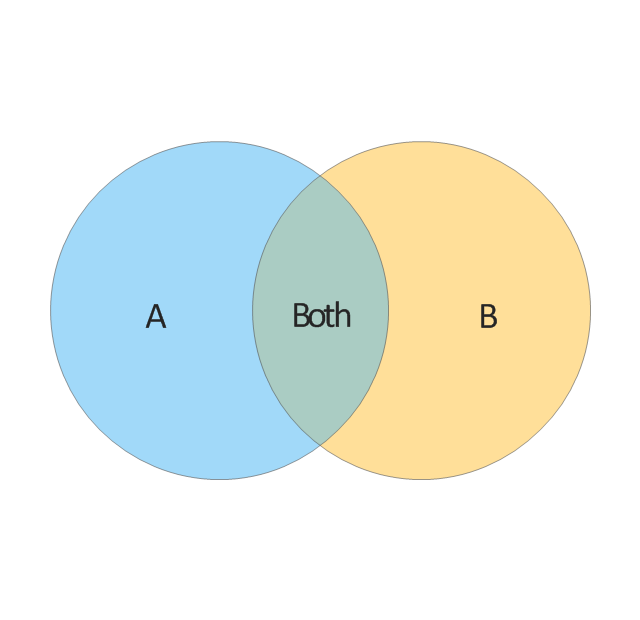
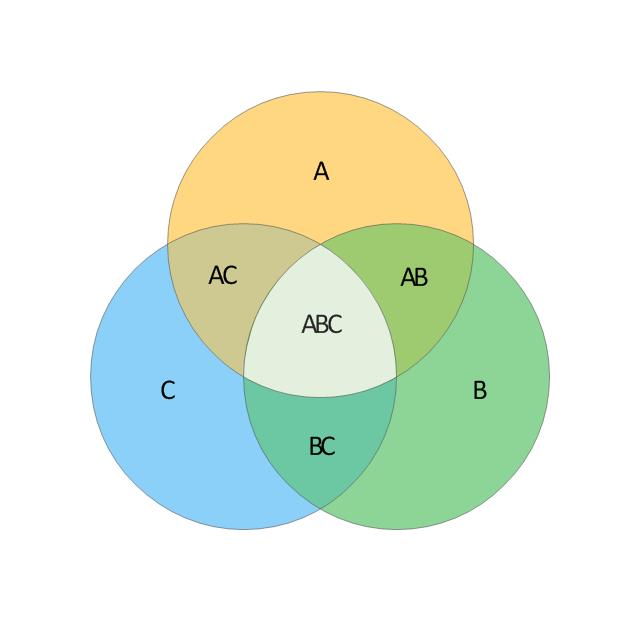
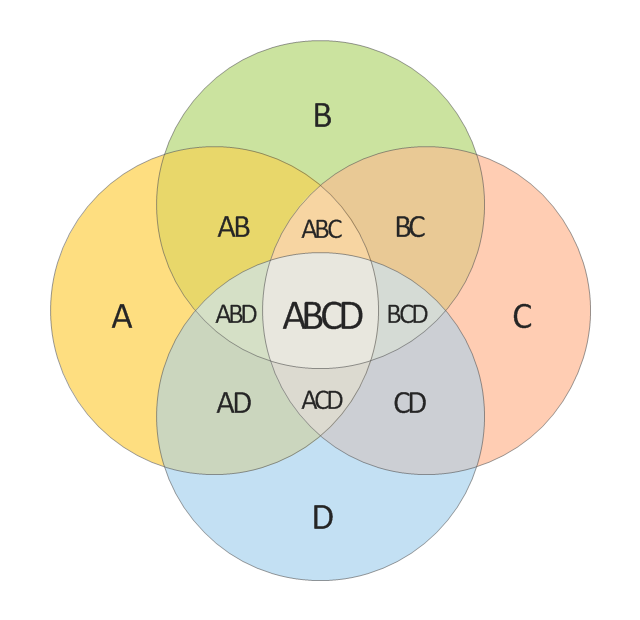
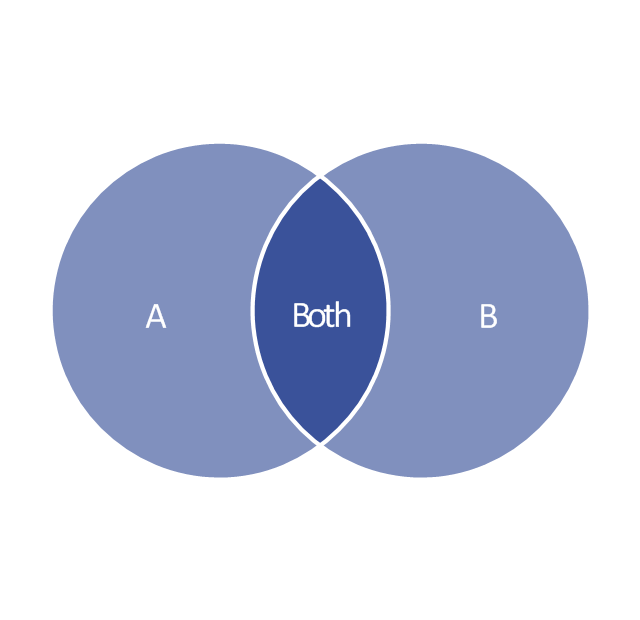
The vector stencils library "Venn diagrams" contains 12 templates of Venn and Euler diagrams.
Use these shapes to draw your Venn and Euler diagrams in the ConceptDraw PRO diagramming and vector drawing software extended with the Venn Diagrams solution from the area "What is a Diagram" of ConceptDraw Solution Park.
Use these shapes to draw your Venn and Euler diagrams in the ConceptDraw PRO diagramming and vector drawing software extended with the Venn Diagrams solution from the area "What is a Diagram" of ConceptDraw Solution Park.
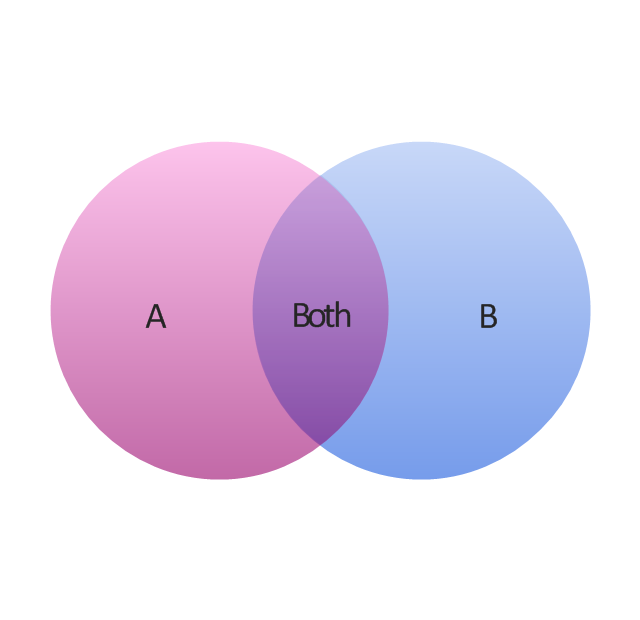
2-set Venn diagram
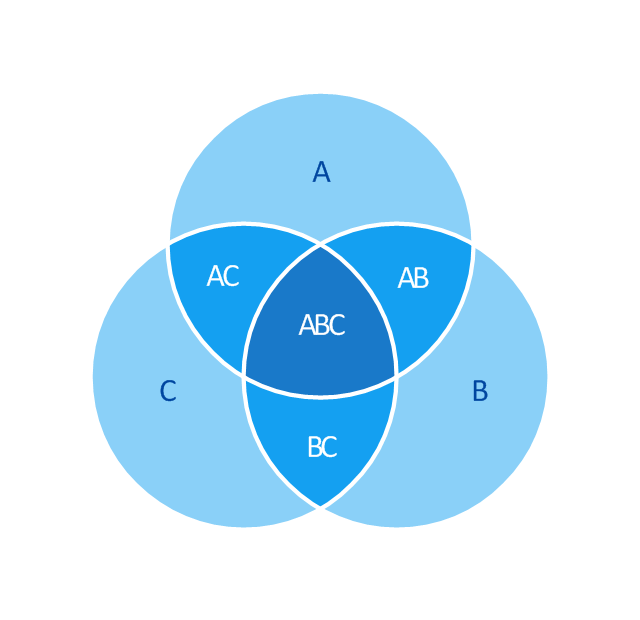
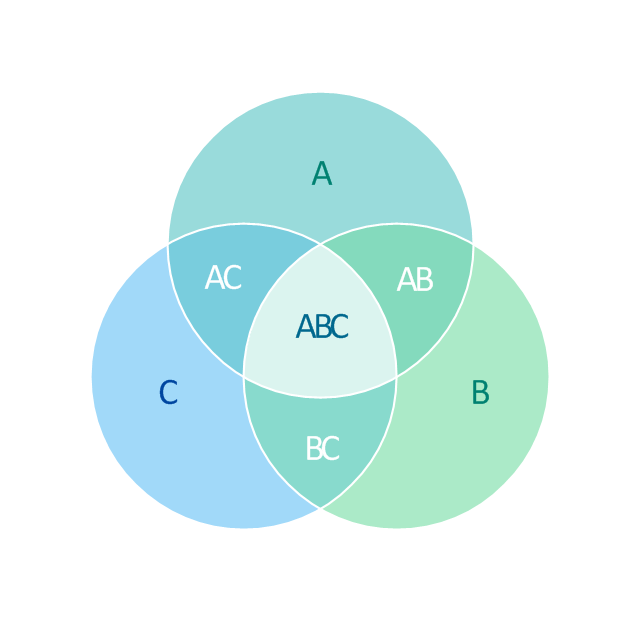
3-set Venn diagram
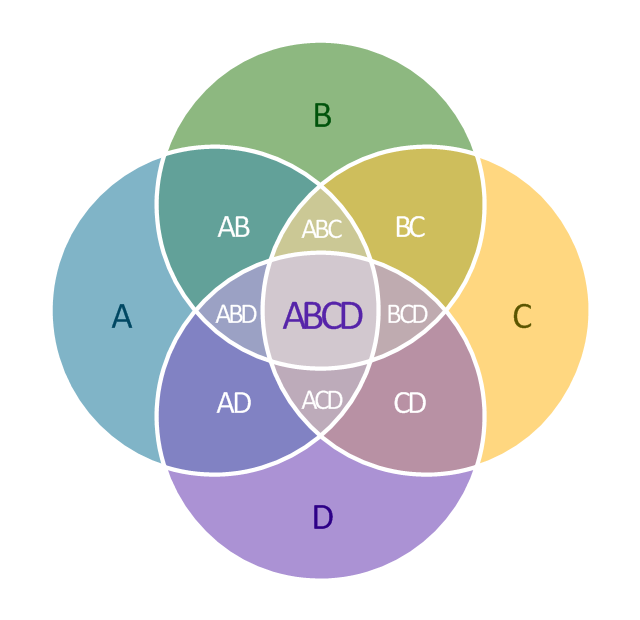
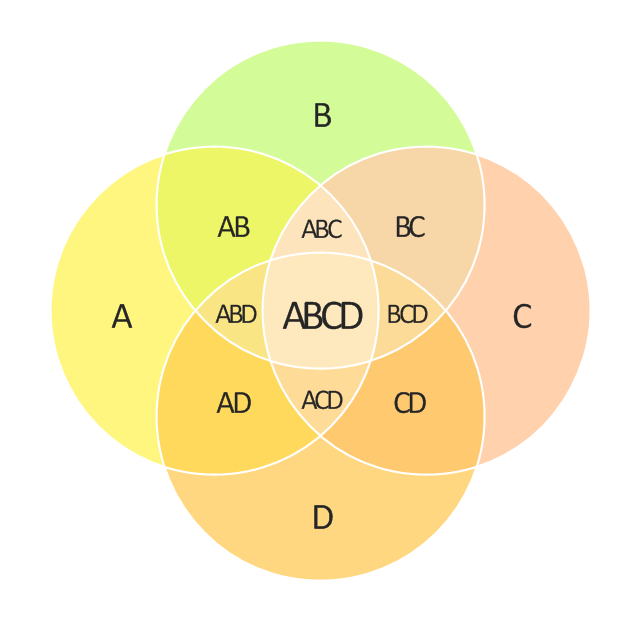
4-set Venn diagram
5-set Venn diagram

2-set Venn diagram
3-set Venn diagram
4-set Venn diagram
5-set Venn diagram
2-set Venn diagram
3-set Venn diagram
4-set Venn diagram
5-set Venn diagram

Venn Diagram Template
Cylinder Venn Diagram

Multi Layer Venn Diagram. Venn Diagram Example

Venn Diagrams

ConceptDraw DIAGRAM diagramming and vector drawing software extended with Venn Diagrams solution from "Diagrams" area offers set of useful drawing tools for easy creating the Venn Diagrams for any quantity of sets.
Venn Diagram Examples
HelpDesk
How to Draw a Pyramid Diagram

The vector stencils library "Circular diagrams" contains 42 templates of circular diagrams: circular arrow diagram, circular motion diagram, arrow ring chart, doughnut chart (donut chart), circle pie chart, diamond pie chart, circle diagram, pie chart, ring chart, loop diagram, block loop diagram, arrow loop circle, crystal diagram, triangular diagram, diamond diagram, pentagon diagram, hexagon diagram, heptagon diagram, cycle diagram (cycle chart), stacked Venn diagram (onion diagram), arrow circle diagram.
Use these shapes to illustrate your marketing and sales documents, presentations, webpages and infographics in the ConceptDraw PRO diagramming and vector drawing software extended with the Target and Circular Diagrams solution from the Marketing area of ConceptDraw Solution Park.
www.conceptdraw.com/ solution-park/ marketing-target-and-circular-diagrams
Circular arrow diagram 1
Circular arrow diagram 2
Arrow ring chart
Doughnut chart

Diamond pie chart

Pie chart

Circle diagram

Circle pie chart 2

Circle pie chart 1

Ring chart 1 - 3 elements

Ring chart 1 - 4 elements

Ring chart 1 - 5 elements

Ring chart 1 - 6 elements

Ring chart 1 - 7 elements

Ring chart 2 - 3 elements

Ring chart 2 - 4 elements

Ring chart 2 - 5 elements

Ring chart 2 - 6 elements

Ring chart 2 - 7 elements

Crystal diagram - 3 elements

Crystal diagram - 4 elements

Crystal diagram - 5 elements

Crystal diagram - 6 elements

Crystal diagram - 7 elements

Stacked Venn diagram - 4

Stacked Venn diagram - 5

Stacked Venn diagram - 6

Stacked Venn diagram - 7

Basic loop diagram

Block loop diagram

Arrow loop circle
Arrow loop - 3 circles
Arrow loop - 4 circles
Arrow loop - 5 circles
Arrow loop - 6 circles
Arrow loop - 7 circles
Arrow circle diagram - 3
Arrow circle diagram - 4
Stacked Venn diagram - 3

Arrow circle diagram - 5
Arrow circle diagram - 6
Arrow circle diagram - 7
Venn Diagram Examples for Problem Solving. Environmental Social Science. Human Sustainability Confluence

Create your Venn diagrams for problem solving in environmental social science using the ConceptDraw DIAGRAM diagramming and vector drawing software extended with the Venn Diagrams solution from the area "Diagrams" of ConceptDraw Solution Park.
 Computer Network Diagrams
Computer Network Diagrams solution extends ConceptDraw DIAGRAM software with samples, templates and libraries of vector icons and objects of computer network devices and network components to help you create professional-looking Computer Network Diagrams, to plan simple home networks and complex computer network configurations for large buildings, to represent their schemes in a comprehensible graphical view, to document computer networks configurations, to depict the interactions between network's components, the used protocols and topologies, to represent physical and logical network structures, to compare visually different topologies and to depict their combinations, to represent in details the network structure with help of schemes, to study and analyze the network configurations, to communicate effectively to engineers, stakeholders and end-users, to track network working and troubleshoot, if necessary.
 Circle-Spoke Diagrams
Examples of subject areas that are well suited to this approach are marketing, business, products promotion, process modeling, market, resource, time, and cost analysis. Circle-Spoke Diagrams are successfully used in presentations, conferences, management documents, magazines, reportages, reviews, reports, TV, and social media.
Pyramid Diagram and Pyramid Chart

- Venn Diagrams | Venn Diagram | How to Create a Venn Diagram in ...
- 5 -Set Venn diagram - Template | Venn diagrams - Vector stencils ...
- Venn Diagram | 5 -Set Venn diagram - Template | 4-Set Venn ...
- 5 -Set Venn diagram - Template | Venn Diagrams | 4-Set Venn ...
- Venn Diagram Maker To Draw Venn Diagrams
- Venn diagrams - Vector stencils library | 2 Circle Venn Diagram ...
- 5 -Set Venn diagram - Template | Workflow Diagram Template ...
- Venn Diagram Template
- 5 -Set Venn diagram - Template | 5 Level pyramid model diagram ...
- Draw Venn Diagram
- 5 -Set Venn diagram - Template | Venn Diagrams | Venn diagrams ...
- Basic Circles Venn Diagram . Venn Diagram Example | Venn ...
- 5 -Set Venn diagram - Template
- Venn Diagram Template for Word | Venn Diagrams | 5 -Set Venn ...
- Online Tool For Drawing 5 Set Venn Diagram
- Venn Diagrams
- Venn Diagrams | Venn Diagrams | How to Create a Venn Diagram in ...
- Venn Diagram With 5 Circles
- Target and Circular Diagrams | How to Draw a Circular Arrows ...
- Circular diagrams - Vector stencils library | Venn Diagrams | How to ...
- ERD | Entity Relationship Diagrams, ERD Software for Mac and Win
- Flowchart | Basic Flowchart Symbols and Meaning
- Flowchart | Flowchart Design - Symbols, Shapes, Stencils and Icons
- Flowchart | Flow Chart Symbols
- Electrical | Electrical Drawing - Wiring and Circuits Schematics
- Flowchart | Common Flowchart Symbols
- Flowchart | Common Flowchart Symbols