Flowchart Components
The ConceptDraw Flowchart component includes a set of samples and templates. This geathered as flowchart maker toolbox which focused on drawing flowcharts of any industry standards.How to Create a Social Media DFD Flowchart
Interactive tool helps you create a social media DFD flowchart to find the appropriate response to social media mentions quickly.It allows companies to be more effective in timely messaging thanks to the ability for rapid response to a customer′s post in social media. This saves budget for companies who use social media for promoting and as a lead generation tool.
Entity Relationship Diagram Symbols
Creating an entity-relationship (ER) model is to visually represent the structure of a business database, where data equates to entities (or objects) that are linked by defined relationships expressing dependencies and requirements. By nature it is an abstract visualization, the first step in the design process towards creating a logical and functional database.ERD symbols used for professional ERD drawing are collected in libraries from the Entity-Relationship Diagram (ERD) solution for ConceptDraw DIAGRAM.
Data Flow Diagram Symbols. DFD Library
Data Flow Diagrams show information transfers and process steps of a system. The general concept is an approach of a depicting how occurs input in a system, further processes and what runs out. The aim of DFD is in accomplishing of understanding between developers and users. Data flow diagrams are maintained with other methods of structured systems analysis.Database Flowchart Symbols
Data base diagrams describes inter-related data and tables. It describes roles and relationships, internal and external dependencies, data exchange conventions and structures of knowledge domain.ConceptDraw Software provides number of data-base chart libraries including major 49 vector symbols. Use these DFD flowchart symbol libraries to design data-base structure and models, use it to design data base process-oriented models, or simple data-oriented models. The are special drawing tools for making data flowcharts, data process diagrams, structured analysis diagrams, and information flow diagrams.
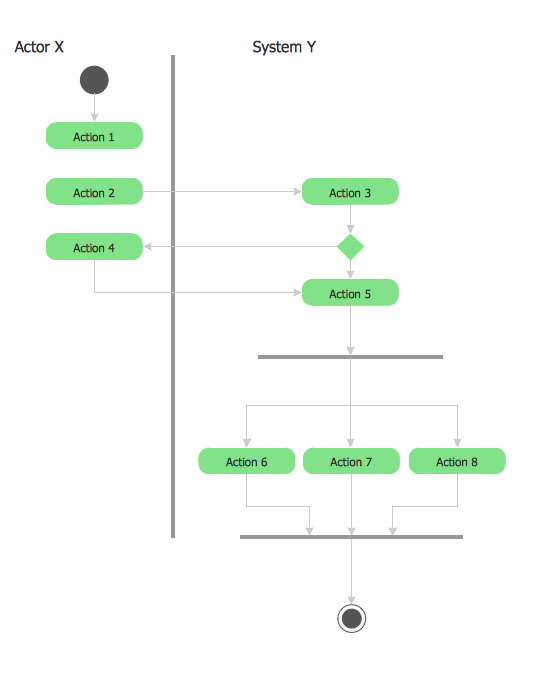
UML 2 4 Process Flow Diagram
This sample was created in ConceptDraw DIAGRAM diagramming and vector drawing software using the UML Activity Diagram library of the Rapid UML Solution from the Software Development area of ConceptDraw Solution Park.Flowchart Definition
Flowchart definition - A Flowchart is a graphically representation of the structure of process or system, algorithm or the step-by-step solution of the problem. The Flowchart describes the flow of data through an information processing systems and the parts of the flows. The flow is a set of the logic operations that meet the certain requirements.Gane Sarson Diagram
The vector stencils library Gane-Sarson Notation from the solution Data Flow Diagrams contains specific symbols of the Gane-Sarson notation such as process symbol, connector symbol, jump symbol for ConceptDraw DIAGRAM diagramming and vector drawing software. The Data Flow Diagrams solution is contained in the Software Development area of ConceptDraw Solution Park.Data structure diagram with ConceptDraw DIAGRAM
Data structure diagram (DSD) is intended for description of conceptual models of data (concepts and connections between them) in the graphic format for more obviousness. Data structure diagram includes entities description, connections between them and obligatory conditions and requirements which connect them. Create Data structure diagram with ConceptDraw DIAGRAM.Data Flow Diagrams
Data Flow Diagrams (DFDs) are graphical representations of the "flow" of data through an information system. Data flow diagrams can be used for the visualization of data processing. ConceptDraw DIAGRAM extended with Data Flow Diagrams Solution is a powerful data flow diagramming application that allows you quickly create any Data Flow Diagrams including the data storages, external entities, functional transforms, data flows, as well as control transforms and signals.UML Object Diagram. Design Elements
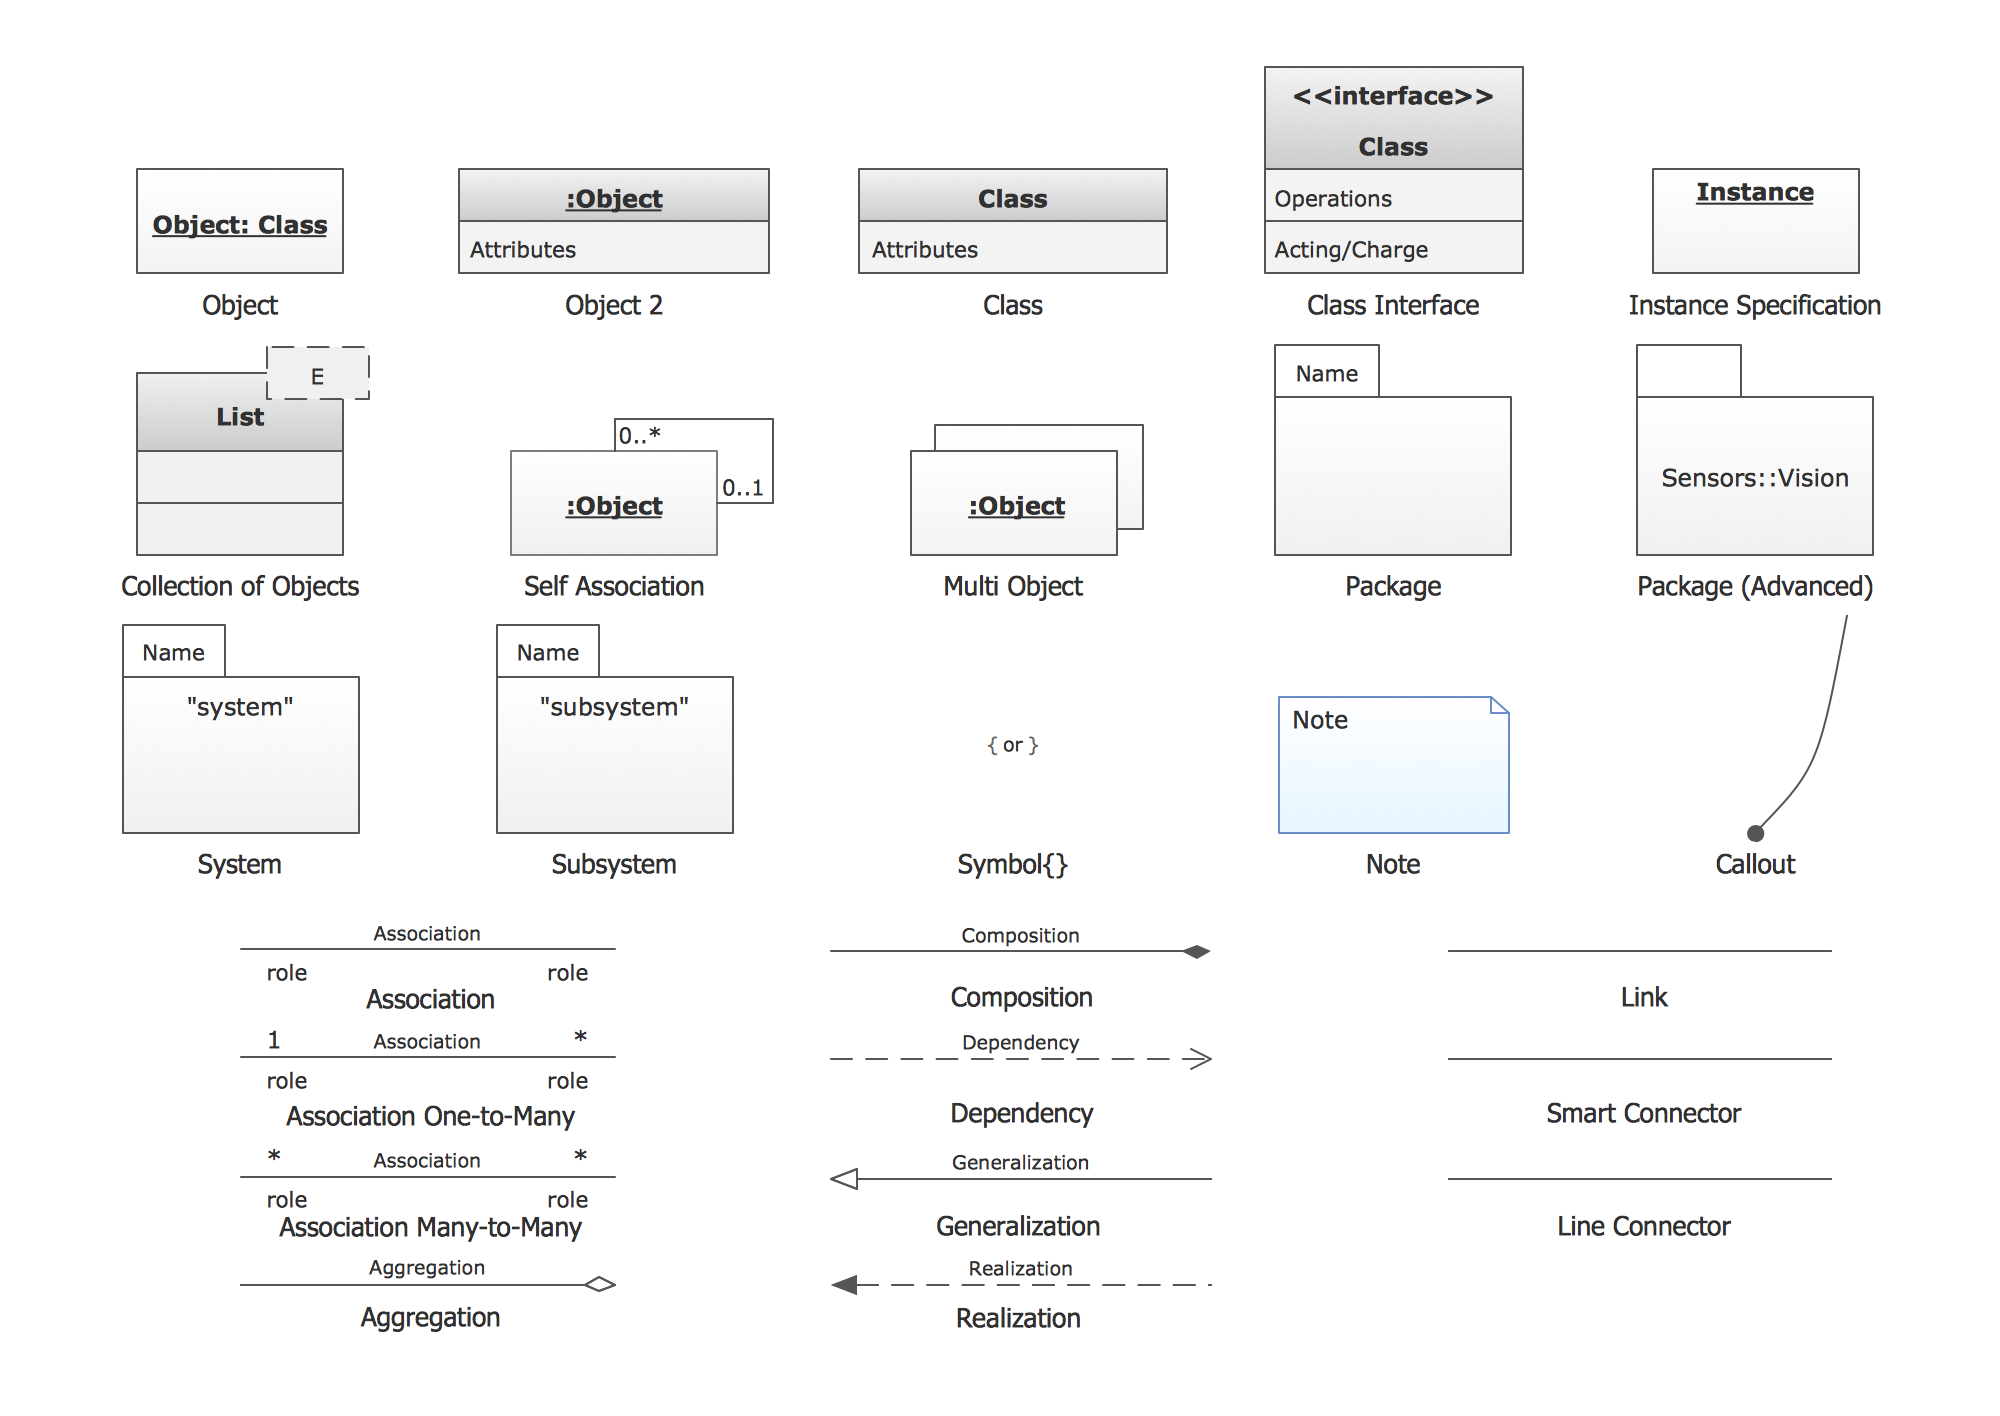
UML Object Diagram shows the structure of a modeled system at a specific time.ConceptDraw has 393 vector stencils in the 13 libraries that helps you to start using software for designing your own UML Diagrams. You can use the appropriate stencils of UML notation from UML Object library.
Flow Chart Online
Flow Chart is a great visualization tool for the flow of a process, algorithm or procedure with a lot of benefits. It is convenient to use a powerful software for creating flow charts. Now we have the best flow chart maker online design software - ConceptDraw DIAGRAM enhanced with Flowcharts Solution from the "Diagrams" Area of ConceptDraw Solution Park.Data Flow Diagram Process
This example is created using ConceptDraw DIAGRAM enhanced with solution Data Flow Diagrams. It shows the process of account receivable.Create Flow Chart on Mac
Use ConceptDraw DIAGRAM diagramming and business graphics software to draw your own flowcharts of business processes. Start creating your own Process Flow Diagram with ConceptDraw DIAGRAM and accomplish great results in the moment.Extended flowchart maker features of Rapid Draw functionality was developed to create flow chart on the Mac OS X platform. You will save time by quick and simple flowchart maker due to Rapid Draw.
BPR Diagram. Business Process Reengineering Example
This sample was created in ConceptDraw DIAGRAM diagramming and vector drawing software using the Business Process Diagram Solution from the Business Processes area of ConceptDraw Solution Park. The Business Process Solution is based on the standard BPMN 2.0 and includes the set of libraries of ready-to-use objects.Gant Chart in Project Management
Gant Chart is a graphical representation of tasks as segments on a time scale. It helps plan and monitor project development or resource allocation. The horizontal axis is a time scale, expressed either in absolute or relative time.
UML Flowchart Symbols
The UML diagram is a powerful tool which lets visually represent all system's components, the interactions between them and relationships with external user interface.The Rapid UML solution for ConceptDraw DIAGRAM software offers diversity of UML flowchart symbols for drawing all types of UML diagrams.
Examples of Flowcharts, Org Charts and More
ConceptDraw examples covers a broad spectrum of business graphics categories. We separated all the graphic documents on application areas and had produced multiple solutions for each of them. ConceptDraw provides a wide variety of examples such as flowcharts, organizational charts, business charts, UML diagrams, database and ERD, directional map, network diagrams and lots more. Each solution accommodates 10+ examples that shows specific application cases of a diagram. ConceptDraw STORE is an application for downloading solutions with examples, templates and stencil libraries. Please choose any examples you are interested in, alternatively download them for free; you will need to install ConceptDraw to view them. As you will see, ConceptDraw is very powerful, you can use more than 10000 symbols, examples, and many pre-drawn templates, to create your own spectacular flowcharts, business diagrams, network diagrams and lots more, effortlessly, and in no time at all.
Data Flow Diagrams
ConceptDraw DIAGRAM software enables you to quickly create data flow diagrams that include data storage, external entities, functional transforms, data flows, and control transforms and signals.Pyramid Diagram
The DIKW Pyramid refers loosely to a class of models for representing purported structural and/or functional relationships between data, information, knowledge, and wisdom.- UML Flowchart Symbols | Entity Relationship Diagram Symbols ...
- Create Organizational Chart | Workflow Chat Of Kitchen
- Data Flow Diagram Example | Technical Flow Chart | Data Flow ...
- Flow Chart Symbols | Data Flow Diagram Process | Data structure ...
- Data structure diagram with ConceptDraw PRO | Dfd Data Modeling ...
- Chat Flow Method
- Purchase Process Flow Chart , Receiving Process Flow Chart ...
- Basic Flowchart Symbols and Meaning | Exam Preparation Mind ...
- Accounting Data Flow from the Accounting Flowcharts Solution ...
- Project management life cycle - Flowchart | Program to Make Flow ...
- Difference Between Data Flow Diagram And Architecture Diagram
- Euclidean algorithm - Flowchart | | Software development with ...
- Examples Of Flow Chart Of Student Database
- Data structure diagram with ConceptDraw PRO | ConceptDraw ...
- Workflow Diagram Data | UML Composite Structure Diagram | UML ...
- Entity Relationship Diagram Symbols | Database Flowchart Symbols ...
- UML Use Case Diagram Example. Services UML Diagram. ATM ...
- Draw A System Model For A School System Using Structure Chart Sad
- Draw A Sketch Of System Development Cycle
- Process Flowchart | Basic Flowchart Symbols and Meaning | Data ...
- ERD | Entity Relationship Diagrams, ERD Software for Mac and Win
- Flowchart | Basic Flowchart Symbols and Meaning
- Flowchart | Flowchart Design - Symbols, Shapes, Stencils and Icons
- Flowchart | Flow Chart Symbols
- Electrical | Electrical Drawing - Wiring and Circuits Schematics
- Flowchart | Common Flowchart Symbols
- Flowchart | Common Flowchart Symbols


