Influence Diagram

Influence diagram represents the directed acyclic graph with three types of nodes and three types of arcs that connect the nodes. Decision node is drawn as a rectangle, Uncertainty node is drawn as an oval, Value node is drawn as an octagon.
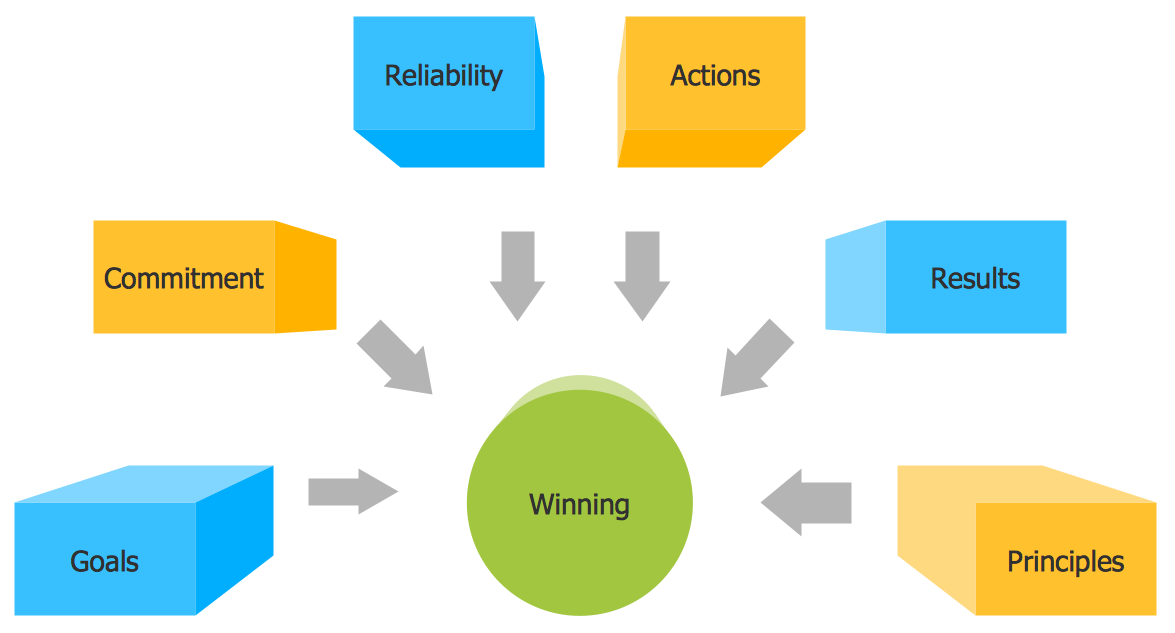
Marketing Charts

Influence Diagram Software

This sample shows the Influence diagram. It is a directed acyclic graph with three types of nodes: Decision node is drawn as a rectangle, Uncertainty node is drawn as an oval, Value node is drawn as an octagon. The nodes are connected with arcs.
Cause and Effect Analysis


Prioritization Matrix

ConceptDraw Arrows10 Technology

- points;
- Connecting groups of objects;
- Auto-routing;
- Connectors text;
- Snap to Guides ;
- Quick.
How to Design Landscape

 Marketing Diagrams
Marketing Diagrams solution extends ConceptDraw DIAGRAM diagramming software with abundance of samples, templates and vector design elements intended for easy graphical visualization and drawing different types of Marketing diagrams and graphs, including Branding Strategies Diagram, Five Forces Model Diagram, Decision Tree Diagram, Puzzle Diagram, Step Diagram, Process Chart, Strategy Map, Funnel Diagram, Value Chain Diagram, Ladder of Customer Loyalty Diagram, Leaky Bucket Diagram, Promotional Mix Diagram, Service-Goods Continuum Diagram, Six Markets Model Diagram, Sources of Customer Satisfaction Diagram, etc. Analyze effectively the marketing activity of your company and apply the optimal marketing methods with ConceptDraw DIAGRAM software.
Illustration Software
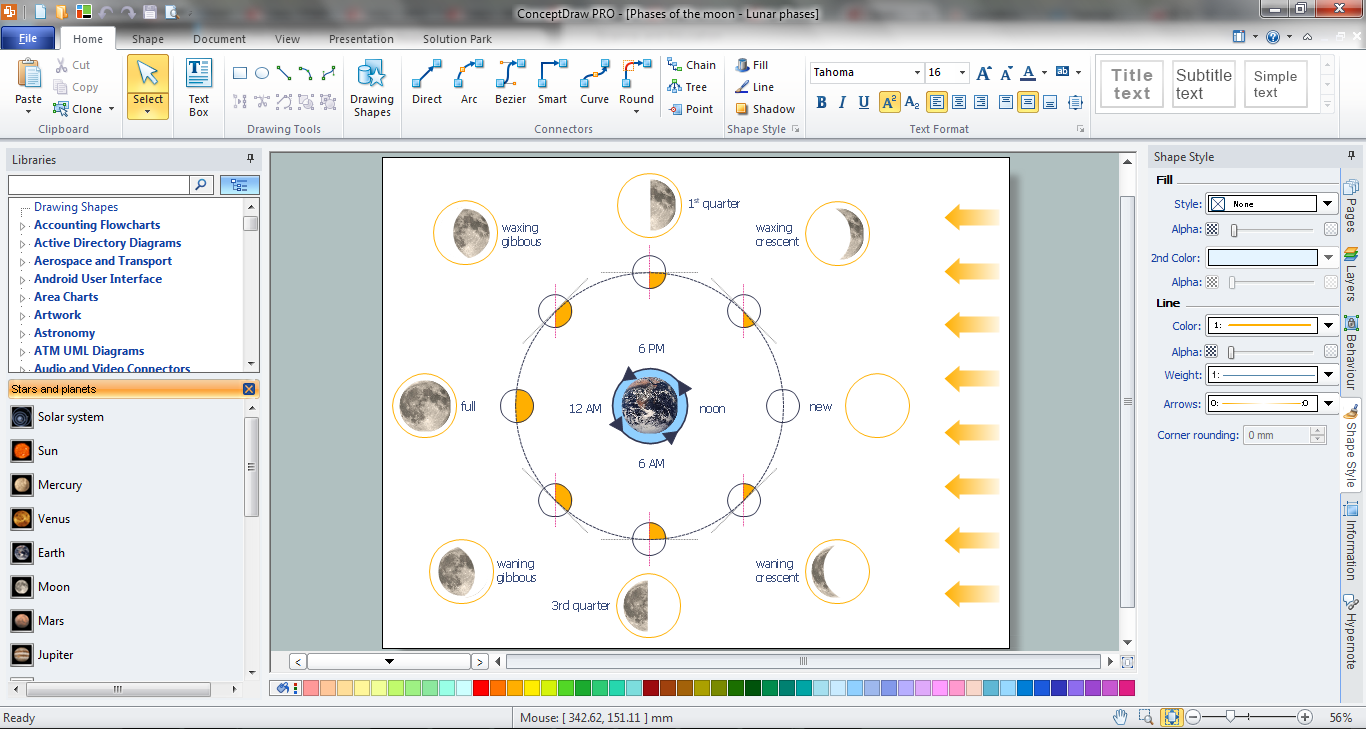
Now we have professional astronomy illustration software - ConceptDraw DIAGRAM illustration and sketching software with templates, samples and libraries of a variety of astronomy symbols, including constellations, galaxies, stars, and planet vector shapes; a whole host of celestial bodies. When drawing scientific and educational astronomy illustrations, astronomy pictures and diagrams, can help you reach for the stars!
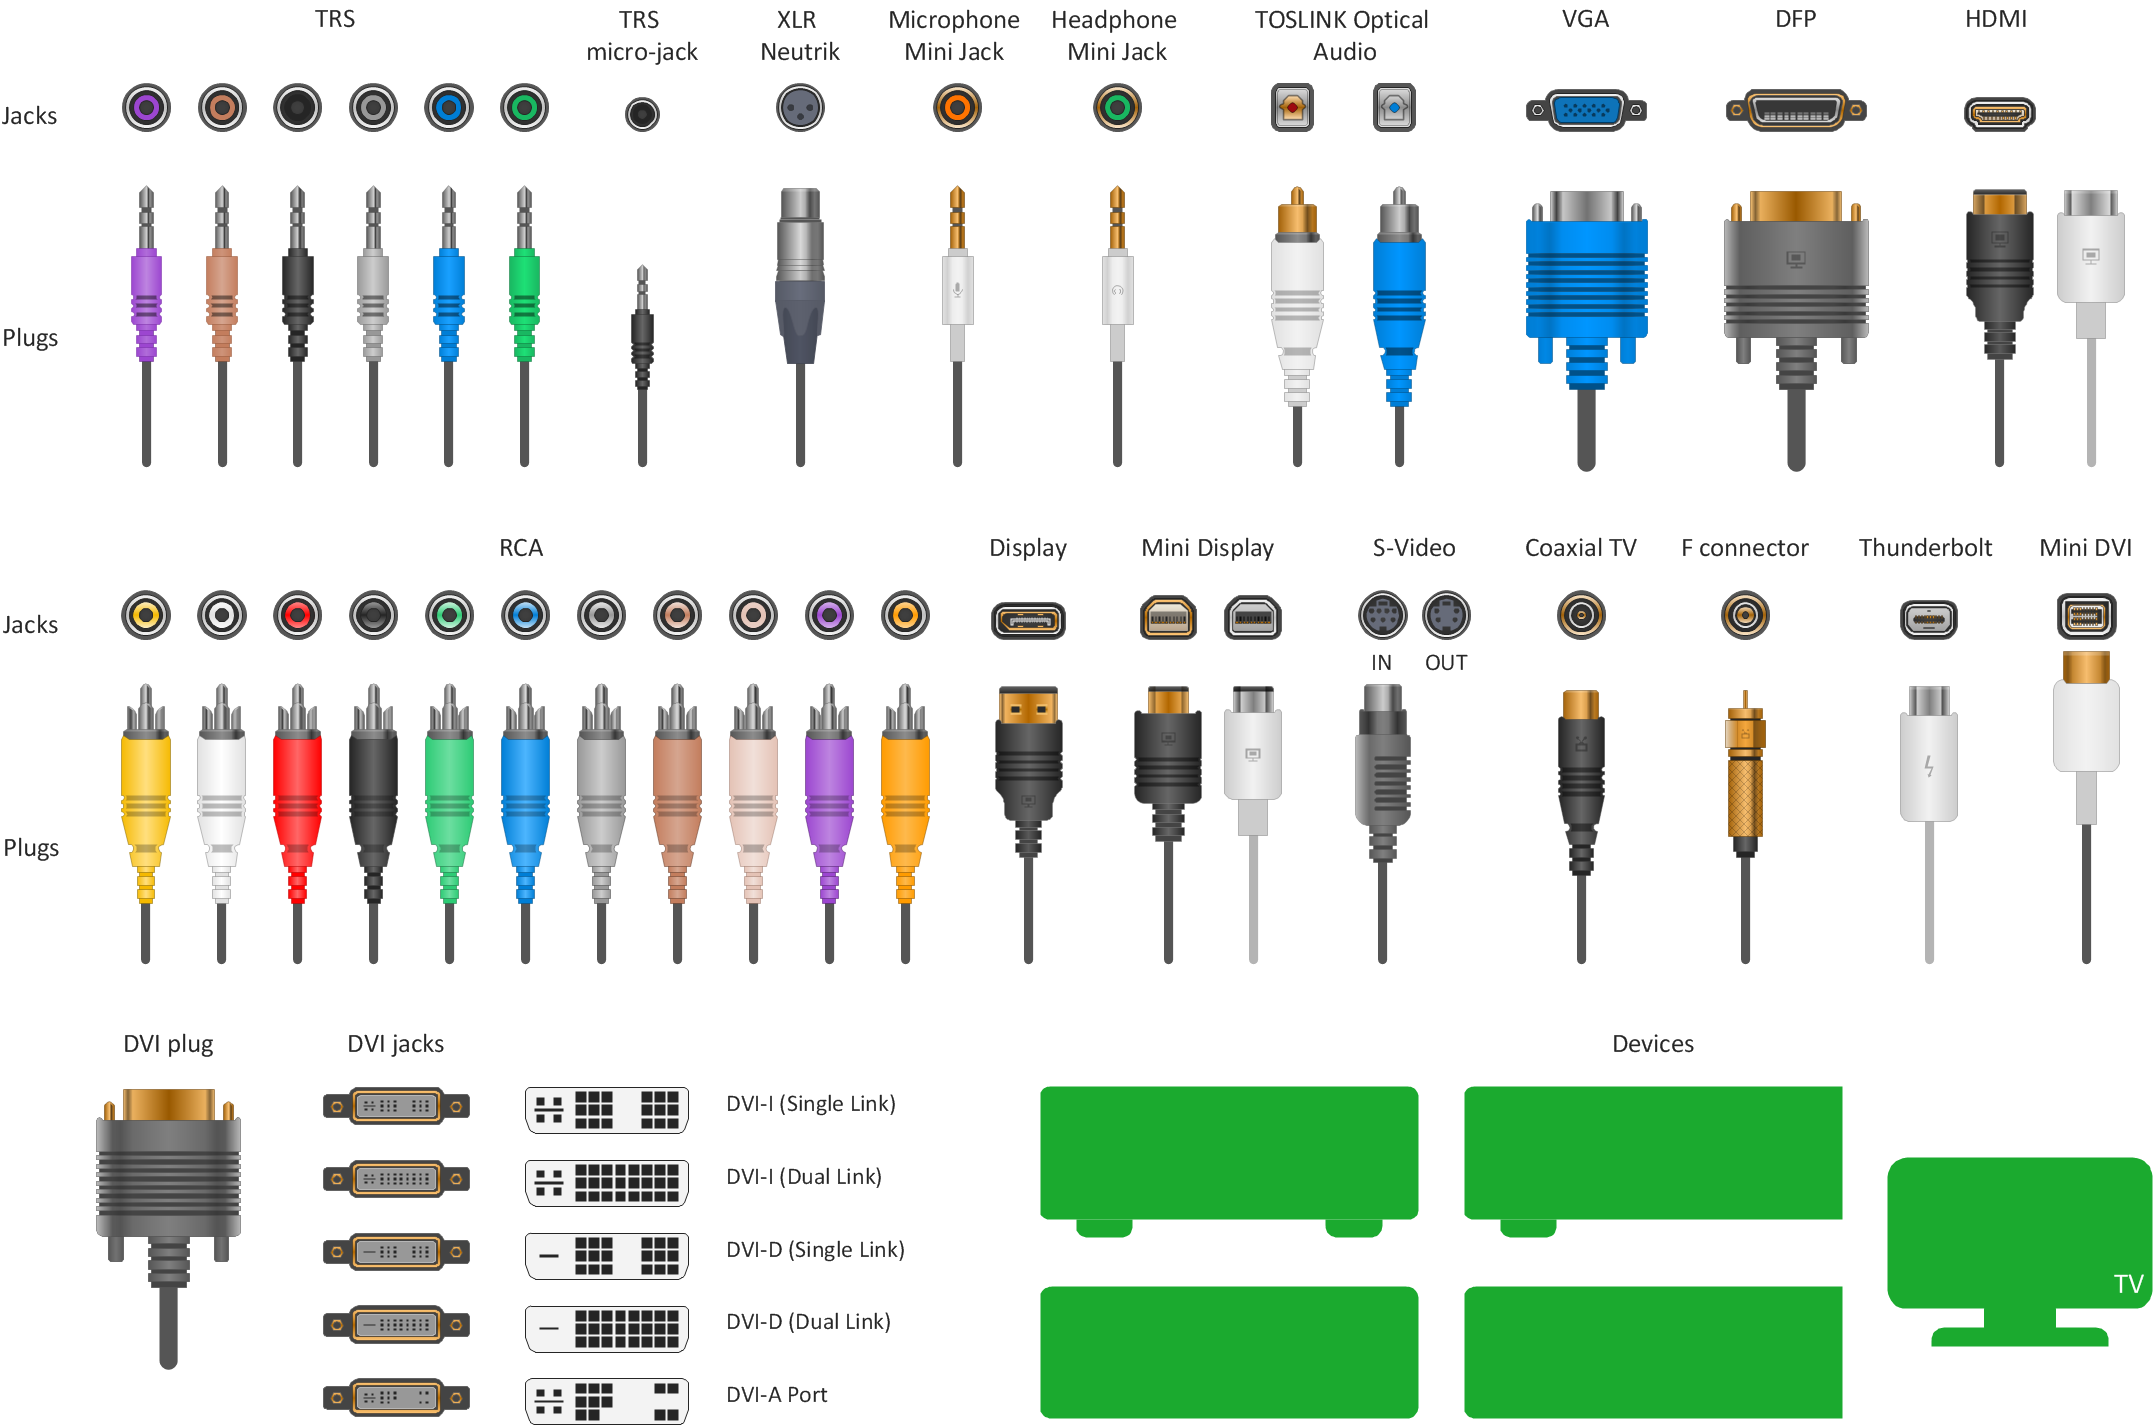
How to Make Audio and Video Connections
Decision Making

The Seven Management and Planning Tools is a set for such diagrams: Affinity Diagram, Relations Diagram, Prioritization Matrix, Root Cause Tree Diagram, Involvement Matrix, PERT Chart, Risk Diagram (PDPC).
MS Visio Look a Like Diagrams

ConceptDraw DIAGRAM delivers full-functioned alternative to MS Visio. ConceptDraw DIAGRAM supports import of Visio files. ConceptDraw DIAGRAM supports flowcharting, swimlane, orgchart, project chart, mind map, decision tree, cause and effect, charts and graphs, and many other diagram types.
Block Diagram Creator
Network Topologies


- Decision tree diagram | Decision Making | Influence Diagram ...
- Decision Tree Template Visio
- Online Decision Tree Maker
- Decision Tree Templates For Free
- Decision Tree Diagram For Online Shopping Managment System
- Decision Tree Sample
- Decision Tree Template
- How To Make A Decision Tree
- Root cause analysis tree diagram - Template | PROBLEM ...
- Decision tree diagram | Marketing Diagrams | Fault Tree Analysis ...
- Decision Making | How To Make the Right Decision in Projects ...
- Decision Making | How To Make the Right Decision in Projects ...
- How To Make the Right Decision in Projects | Decision Making ...
- Decision Tree Maker
- Decision Making | Block diagram - Customer decision making ...
- Decision Charts
- Representing Organization Decision Making On Decision Tree
- PROBLEM ANALYSIS. Root Cause Analysis Tree Diagram | Fault ...
- Decision Making | Types of Flowcharts | Workflow Diagram ...
- Block diagram - Customer decision making | Influence Diagram ...
- ERD | Entity Relationship Diagrams, ERD Software for Mac and Win
- Flowchart | Basic Flowchart Symbols and Meaning
- Flowchart | Flowchart Design - Symbols, Shapes, Stencils and Icons
- Flowchart | Flow Chart Symbols
- Electrical | Electrical Drawing - Wiring and Circuits Schematics
- Flowchart | Common Flowchart Symbols
- Flowchart | Common Flowchart Symbols