Process Flowchart
ConceptDraw is Professional business process mapping software for making process flow diagram, workflow diagram, general flowcharts and technical illustrations for business documents. It is includes rich examples, templates, process flowchart symbols. ConceptDraw flowchart maker allows you to easier create a process flowchart. Use a variety of drawing tools, smart connectors, flowchart symbols and shape libraries to create flowcharts of complex processes, process flow diagrams, procedures and information exchange.
HelpDesk
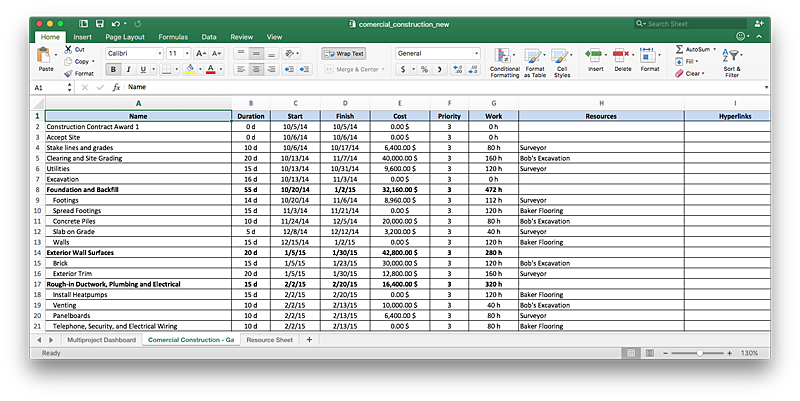
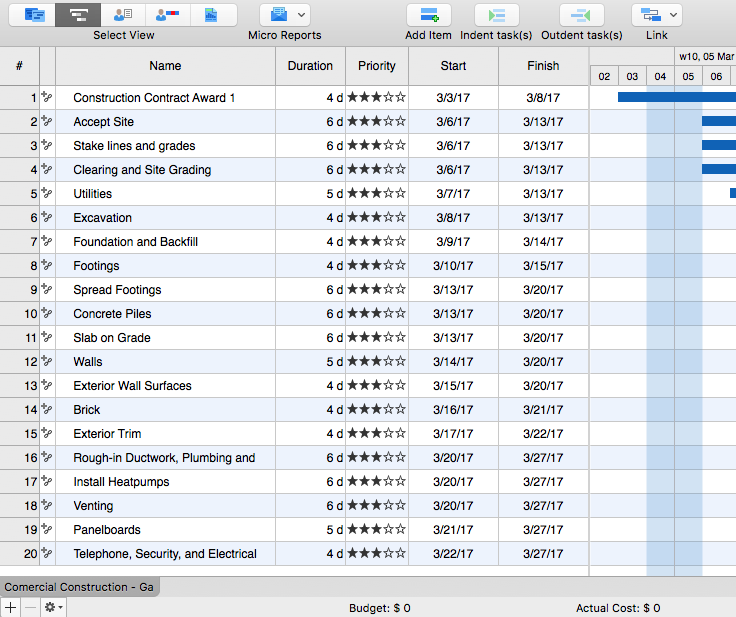
How to Export Project Data to MS Excel Worksheet
You can share your ConceptDraw PROJECT files with colleagues who use MS Excel®using the export capabilities of ConceptDraw PROJECT.HelpDesk
How to Resize Objects
When creating diagram using ConceptDraw PRO, you can select, move, resize and rotate objects. After selecting an object (or objects) in a document, you can change it position, resize it or move an object to the desired position. The sizes of objects in ConceptDraw PRO can be changed by simple dragging, or you can set a particular size of any object. Using ConceptDraw PRO, you can re-size an object on the page using the absolute measurements instead of a mouse. You can make quick work of designing complex drawing using a combination of different-sized items.HelpDesk
How to Use ConceptDraw Sales Dashboard Solution
The interactive visual dashboard is a valuable tool for any sales team. Sales dashboard allows you to view and monitor sales indicators that are important for manager and sales staff . It helps to use the timely and reliable information to improve the quality of sales performance and increase sales revenues. ConceptDraw Sales Dashboard solution is a tool for both: sales manager and sales team. It provides the visualization of key performance indicators that are critical to the entire sales organization. The custom sales dashboard displays the real-time information on sales performance KPIs with the help of intuitive and easy-to-understand diagrams and charts. Sales Dashboard helps the entire team see where they are, and what needs to be done. With ConceptDraw PRO you can easily create a visual Sales Dashboard using Live Objects Technology.
HelpDesk
How to Create a Sales Dashboard
Visual dashboard is a valuable tool for any sales team. Sales dashboard allows you to view and monitor sales indicators that are important for manager and sales staff . It helps to use the timely and reliable information to improve the quality of sales performance and increase sales revenues. ConceptDraw Sales Dashboard solution is a tool for both: sales manager and sales team. It provides the visualization of key performance indicators that are critical to the entire sales organization. The custom sales dashboard displays the real-time information on sales performance KPIs with the help of intuitive and easy-to-understand diagrams and charts.HelpDesk
How to Import Project Data From MS Excel File
You can import information into the project from MS Excel workbook using the entered fields - fields in which you can enter or edit information as opposed to calculated fields.Pie Graph Worksheets
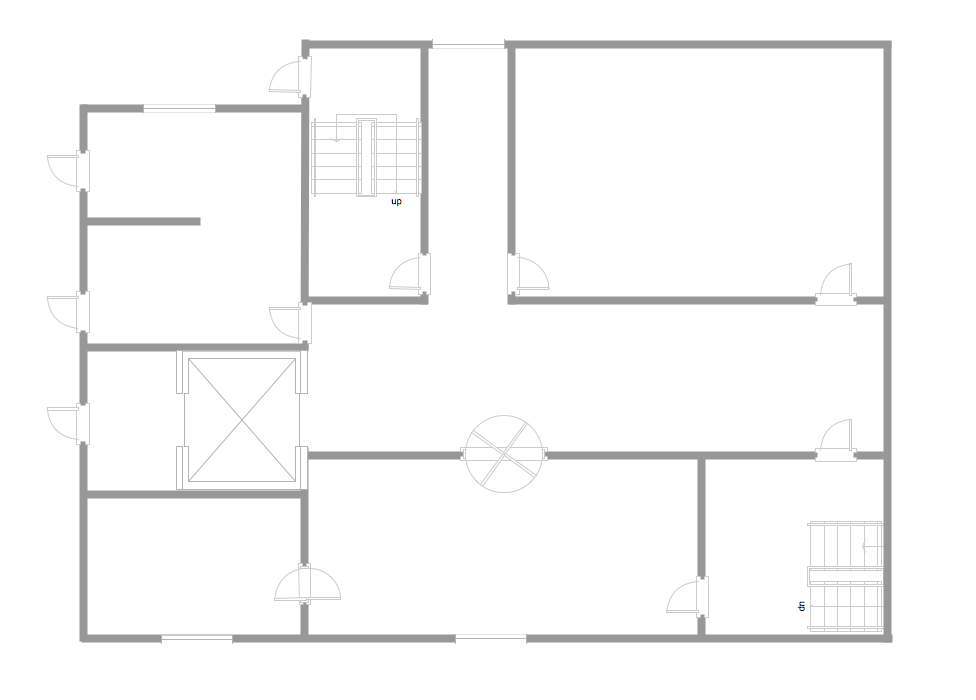
Pie Graph is very popular kind of charts which is widely used in various fields of science and life activities. ConceptDraw PRO extended with Pie Charts Solution from the Graphs and Charts area is the best software for drawing the Pie Graph Worksheets.Template Restaurant Floor Plan for Kids
This template shows the restaurant floor plan for kids. The floor plans are necessary for architects, builders, designers. It’s very simple, convenient and quick to design the professional looking Floor Plans of any difficulty in ConceptDraw PRO.Use the ready-to-use predesigned objects, templates and samples from the Floor Plans Solution for ConceptDraw PRO you can create your own Floor Plans quick and easy.
HelpDesk
How to Input Data from MS Excel Into a Mind Map
Many people apply Excel documents to store data in the form of hierarchical lists. With ConceptDraw MINDMAP you can easily turn the linear structure of an Excel table in a radial structure of mind map ConceptDraw MINDMAP will create a mind map file (CDMZ) from your Excel (XLS) file. If you keep your information in the Microsoft Excel files, you can import them into ConceptDraw MINDMAP, converting the columns and rows to a hierarchical structured mind map. If you have multiple individual sheets in your Excel workbook, ConceptDraw MINDMAP will turn them into a single multi-page mind map. ConceptDraw MINDMAP lets you import an entire Microsoft® Excel file as well as insert data from the selected cells.
 Pie Charts
Pie Charts are extensively used in statistics and business for explaining data and work results, in mass media for comparison (i.e. to visualize the percentage for the parts of one total), and in many other fields. The Pie Charts solution for ConceptDraw PRO v10 offers powerful drawing tools, varied templates, samples, and a library of vector stencils for simple construction and design of Pie Charts, Donut Chart, and Pie Graph Worksheets.
Biology Symbols
ConceptDraw PRO diagramming and vector drawing software extended with Biology solution from the Science and Education area offers a set of useful tools for fast and easy drawing of various biology illustrations and drawings.Biology solution provides 3 libraries with large quantity of vector biology symbols: Biochemistry of Metabolism Library, Carbohydrate Metabolism Library, Citric Acid Cycle (TCA Cycle) Library.
- Schedule pie chart - Daily action plan | Pie Graph Worksheets ...
- Bar Diagrams for Problem Solving. Create space science bar charts ...
- Import process - Flowchart | How to Import Project Data From MS ...
- PM Easy | How to Export Project Data to MS Excel Worksheet | How ...
- Pie Graph Worksheets | Pie Charts | How To Draw Statistics Chart Of ...
- Pie Graph Worksheets | Pie Charts | Draw In Pi Chart Air
- Pie Chart Software | Pie Graph Worksheets | How to Create a Pie ...
- Percentage Chart Of Air
- How to Export Project Data to MS Excel Worksheet | How to ...
- How to Export Project Data to MS Excel Worksheet | How to ...
- Network Topologies | Tree Network Topology Diagram | Fully ...
- Pie Graph Worksheets | Pie Chart Examples and Templates | How to ...
- How to Export Project Data to MS Excel Worksheet | How to Track ...
- Percentage Pie Chart. Pie Chart Examples | Pie Graph Worksheets ...
- Best Free Software For Drawing Biology Diagram
- Line Graph Charting Software | Pie Graph Worksheets | Pie Chart ...
- Network Diagram Examples
- Pie Charts | Pie Graph Worksheets | Draw Apie Chart Of ...
- PROBLEM ANALYSIS. Root Cause Analysis Tree Diagram | Root ...
- Business Statistics Diagram
- ERD | Entity Relationship Diagrams, ERD Software for Mac and Win
- Flowchart | Basic Flowchart Symbols and Meaning
- Flowchart | Flowchart Design - Symbols, Shapes, Stencils and Icons
- Flowchart | Flow Chart Symbols
- Electrical | Electrical Drawing - Wiring and Circuits Schematics
- Flowchart | Common Flowchart Symbols
- Flowchart | Common Flowchart Symbols


