HelpDesk
How to Create a Bank ATM Use Case Diagram

ConceptDraw DIAGRAM diagramming software, enhanced and expanded with the ATM UML Diagrams solution, offers the full range of icons, templates and design elements needed to faithfully represent ATM and banking information system architecture using UML standards. The ATM UML Diagrams solution is useful for beginner and advanced users alike. More experienced users will appreciate a full range of vector stencil libraries and ConceptDraw DIAGRAM's powerful software, that allows you to create your ATM UML diagram in a matter of moments.
UML Class Diagram Constructor
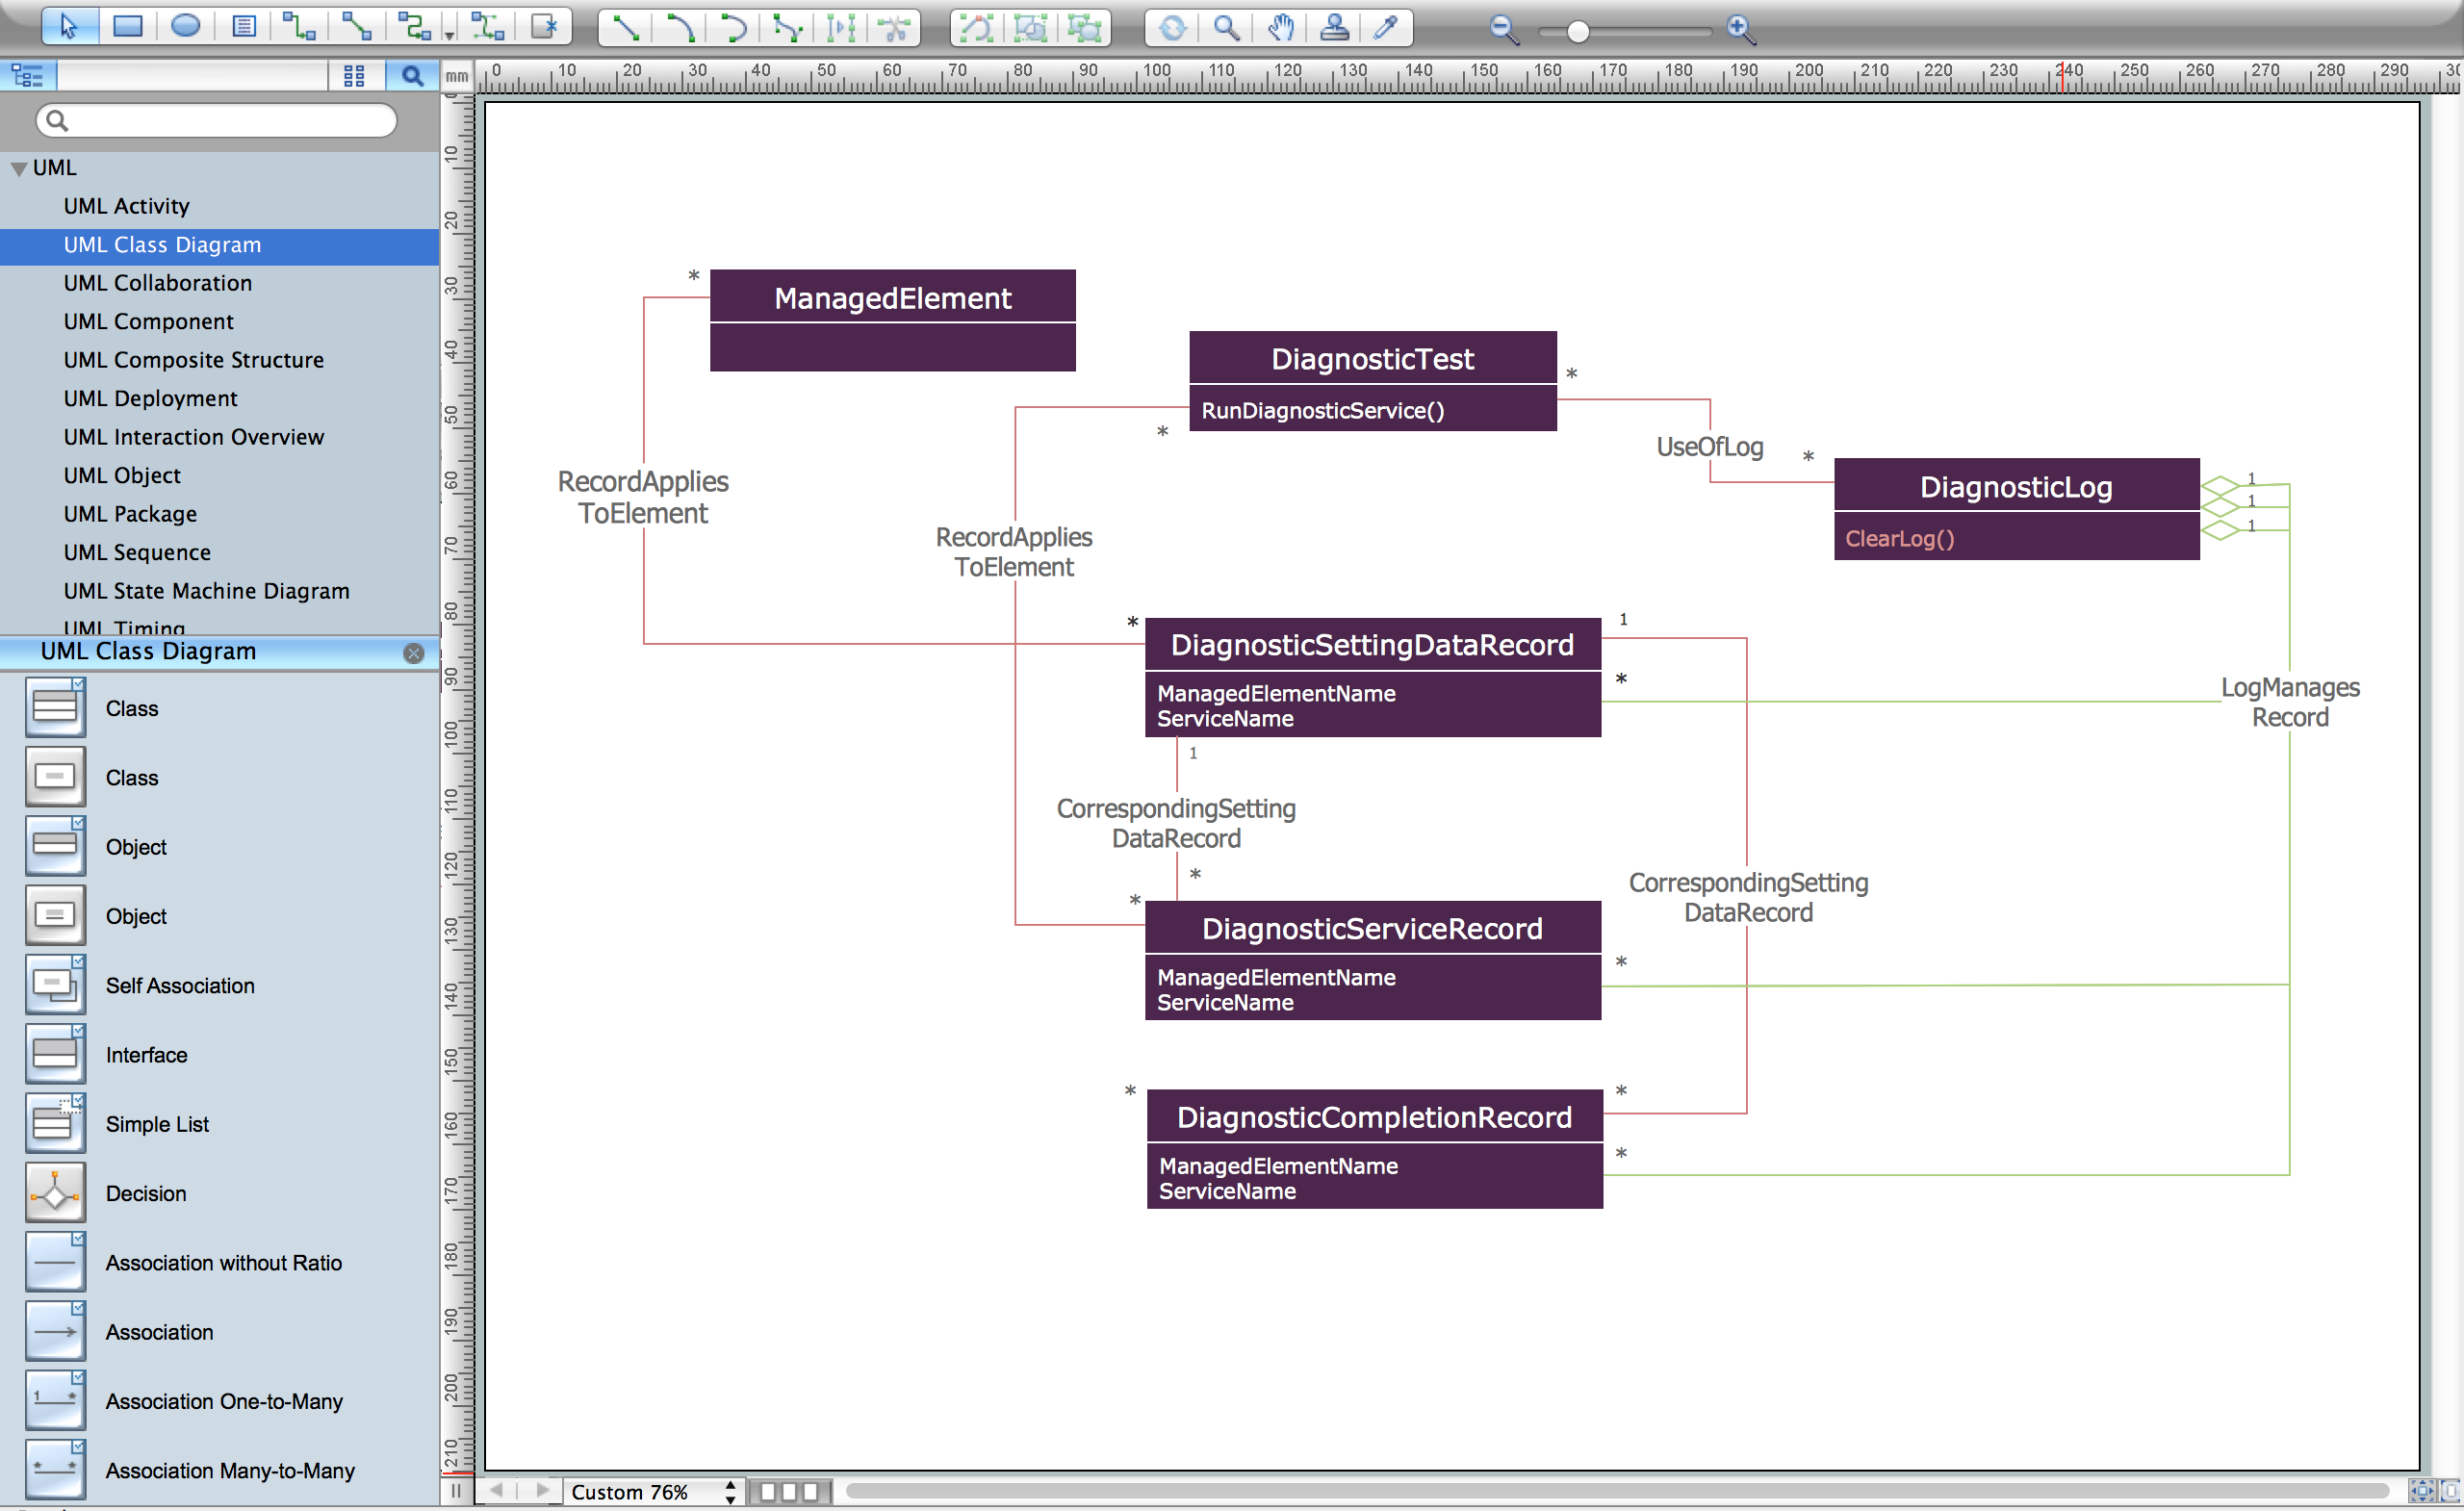
The Rapid UML Solution for ConceptDraw DIAGRAM includes the UML Class Diagram library that helps you to design the UML Class Diagram quick and easy. You can simply and quickly drop the ready-to-use objects from the library into your document to create the UML Class Diagram.
Entity Relationship Diagram Symbols

ERD symbols used for professional ERD drawing are collected in libraries from the Entity-Relationship Diagram (ERD) solution for ConceptDraw DIAGRAM.
UML Block Diagram

This sample shows the work of the taxi service and is used by taxi stations, by airports, in the tourism field and delivery service.
Flowchart Components

UML Diagram

Create unified modeling language (UML) diagrams with ConceptDraw.
UML Use Case Diagram Example. Registration System

This sample was created in ConceptDraw DIAGRAM diagramming and vector drawing software using the UML Use Case Diagram library of the Rapid UML Solution from the Software Development area of ConceptDraw Solution Park.
This sample shows the types of user’s interactions with the system and is used at the registration and working with the database system.
ConceptDraw DIAGRAM ER Diagram Tool

ConceptDraw ER Diagram Tool works across any platform, meaning you never have to worry about compatibility again. ConceptDraw DIAGRAM allows you to make Entity-Relationship Diagram (ERD) on PC or macOS operating systems.
Database Flowchart Symbols

ConceptDraw Software provides number of data-base chart libraries including major 49 vector symbols. Use these DFD flowchart symbol libraries to design data-base structure and models, use it to design data base process-oriented models, or simple data-oriented models. The are special drawing tools for making data flowcharts, data process diagrams, structured analysis diagrams, and information flow diagrams.
UML Diagram Types List

- Entity Relationship Diagram Symbols | ERD Symbols and Meanings ...
- ATM Network. Computer and Network Examples | ATM UML ...
- Swim Lane Diagrams | Swim Lane Flowchart Symbols | Cross ...
- UML Use Case Diagram Example. Services UML Diagram . ATM ...
- Bank Sequence Diagram | ATM UML Diagrams | Bank ATM use ...
- UML Class Diagram Notation | Design elements - ERD (crow's foot ...
- UML Deployment Diagram Example - ATM System UML diagrams ...
- ATM Sequence diagram | UML activity diagram - Cash withdrawal ...
- UML Activity Diagram | UML Diagram of Parking | UML Deployment ...
- Bank System | Banking System | Class UML Diagram for Bank ...
- ERD | Entity Relationship Diagrams, ERD Software for Mac and Win
- Flowchart | Basic Flowchart Symbols and Meaning
- Flowchart | Flowchart Design - Symbols, Shapes, Stencils and Icons
- Flowchart | Flow Chart Symbols
- Electrical | Electrical Drawing - Wiring and Circuits Schematics
- Flowchart | Common Flowchart Symbols
- Flowchart | Common Flowchart Symbols