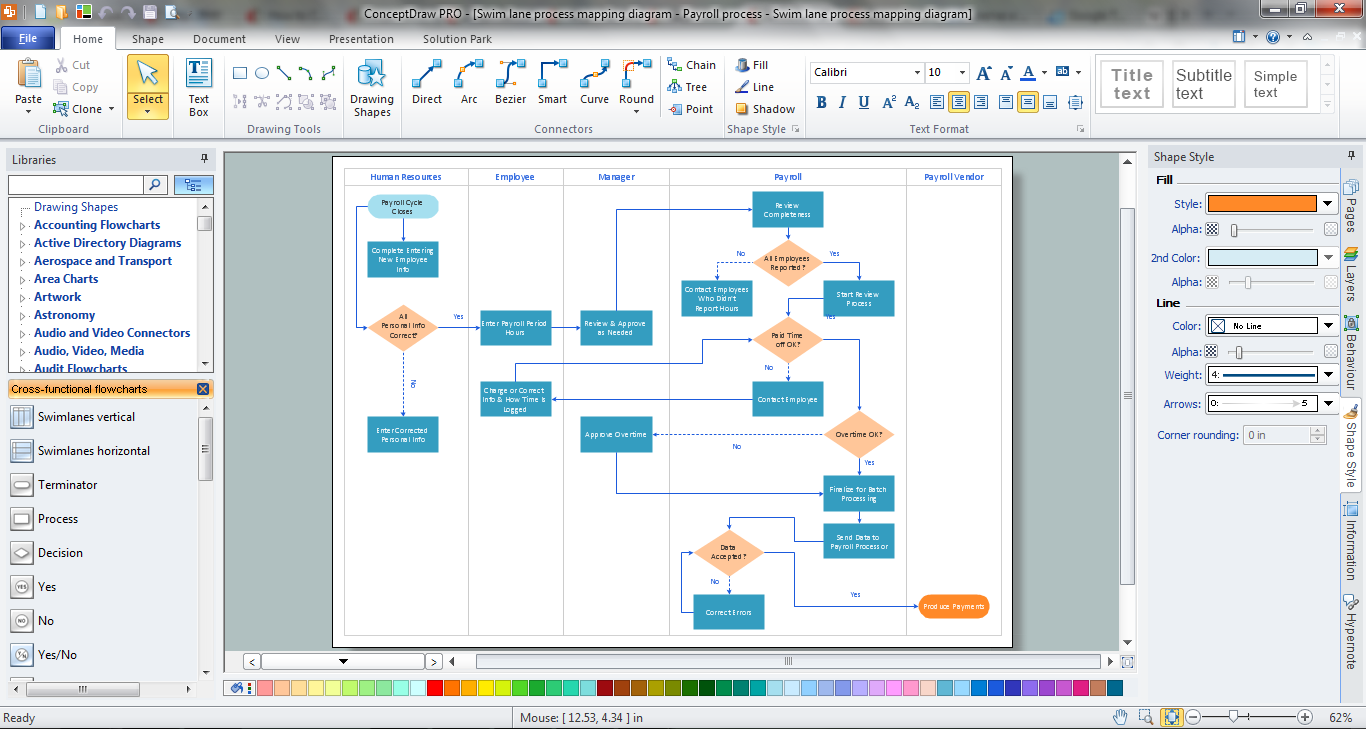
Cross-Functional Flowchart

Use cross-functional flowcharts to show the relationship between a business process and the functional units (such as departments) responsible for that process. To create it use the best flowchart maker of ConceptDraw DIAGRAM.

Flowchart design. Flowchart symbols, shapes, stencils and icons

Mavericks have always desired to stand apart and gorgeous design is the recipe for that. Any business graphic document will be more understandable if will use an expository color scheme for their parts. Flowchart design makes versatile presenting and explaining of the process and gives a fresh view that distinguishes it from black and white flowcharts on a paper. Workflow diagram or process flow diagrams become more understandable to ordinary people when it use minimum symbols and special signs.
The best design can be accomplished by starting from any of the suitable Conceptdraw examples. Pick one of them and begin to input proper text into each Flowchart symbols and shapes. Apply less colors in the document and don't turn into rainbow your diagram, three or four will be enough, also note that business process flowchart may not contain bright color hues. The next clue is to use identical colors for same flowchart shape types.

Swim Lane Diagrams

Flowchart design. Flowchart symbols, shapes, stencils and icons
Mavericks have always desired to stand apart and gorgeous design is the recipe for that. Any business graphic document will be more understandable if will use an expository color scheme for their parts. Flowchart design makes versatile presenting and explaining of the process and gives a fresh view that distinguishes it from black and white flowcharts on a paper. Workflow diagram or process flow diagrams become more understandable to ordinary people when it use minimum symbols and special signs.
The best design can be accomplished by starting from any of the suitable Conceptdraw examples. Pick one of them and begin to input proper text into each Flowchart symbols and shapes. Apply less colors in the document and don't turn into rainbow your diagram, three or four will be enough, also note that business process flowchart may not contain bright color hues. The next clue is to use identical colors for same flowchart shape types.
Cross Functional Flowchart
The Best Business Process Modeling Software
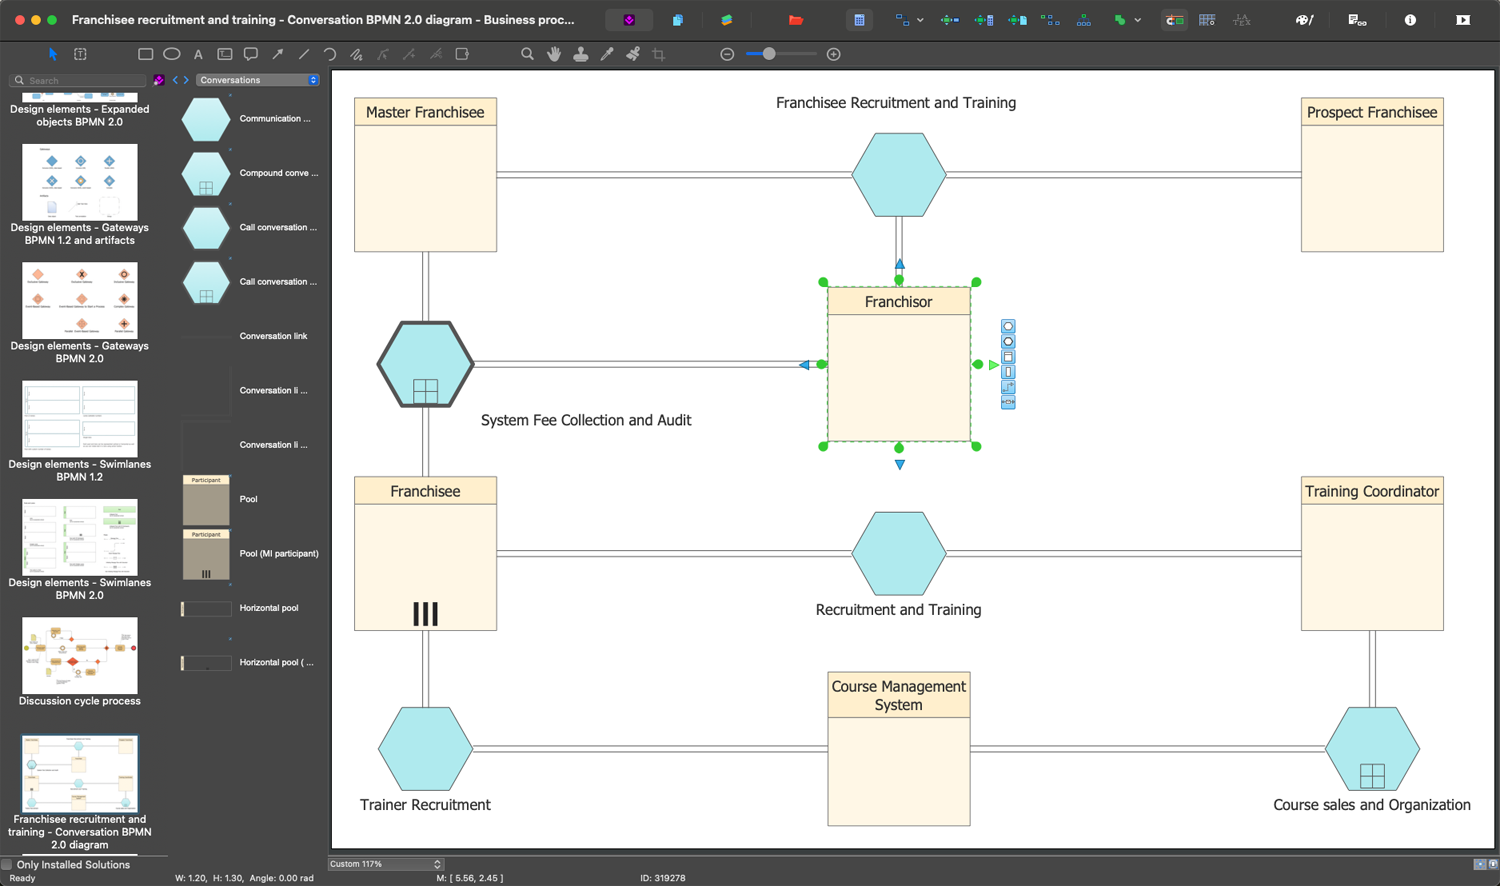
ConceptDraw has 142 vector stencils in the 8 libraries that helps you to start using Diagramming Software for designing own Business Process Diagrams.

Sample Pictorial Chart. Sample Infographics

Use Pictorial Infographics solution to draw your own design pictorial infographics documents quick and easy.
Percentage Pie Chart. Pie Chart Examples

This sample shows the Pie Chart of the approximate air composition. You can see the percentage of oxygen, nitrogen and other gases in the air visualized on this Pie Chart.
Chemical Engineering

Pie Chart Examples and Templates

Pie chart examples and templates created using ConceptDraw DIAGRAM software helps you get closer with pie charts and find pie chart examples suite your needs.
- Swimlanes In Powerpoint
- Draw Flowcharts With Word And Powerpoint
- Basic Flowchart Symbols and Meaning | Cross Functional Flowchart ...
- Cross-Functional Flowcharts | How to Add a Cross-Functional ...
- Cross-Functional Flowchart | Double-headed Cross Functional ...
- How to Create PowerPoint Presentation from Data Driven ...
- Atmosphere air composition | Percentage Pie Chart. Pie Chart ...
- Window elements - Vector stencils library | Windows 8 apps - Vector ...
- Process Flow Chart Symbols | Business People Figures | Types of ...
- https://www.conceptdraw.com/examples/uuo-element daily 0.56 http ...
- ERD | Entity Relationship Diagrams, ERD Software for Mac and Win
- Flowchart | Basic Flowchart Symbols and Meaning
- Flowchart | Flowchart Design - Symbols, Shapes, Stencils and Icons
- Flowchart | Flow Chart Symbols
- Electrical | Electrical Drawing - Wiring and Circuits Schematics
- Flowchart | Common Flowchart Symbols
- Flowchart | Common Flowchart Symbols