HelpDesk
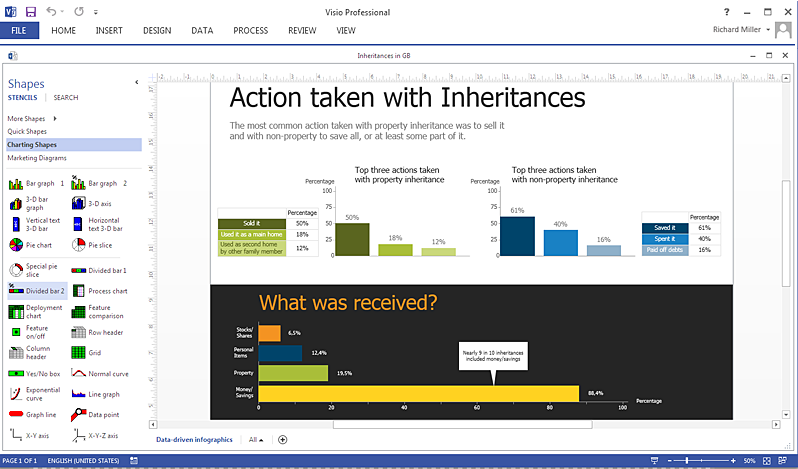
How To Create a MS Visio Data-driven Infographics Using ConceptDraw PRO
ConceptDraw PRO allows you to easily create data-driven infographics of any complexity and then make a MS Visio file from your diagram in a few simple steps.Map Infographic Design
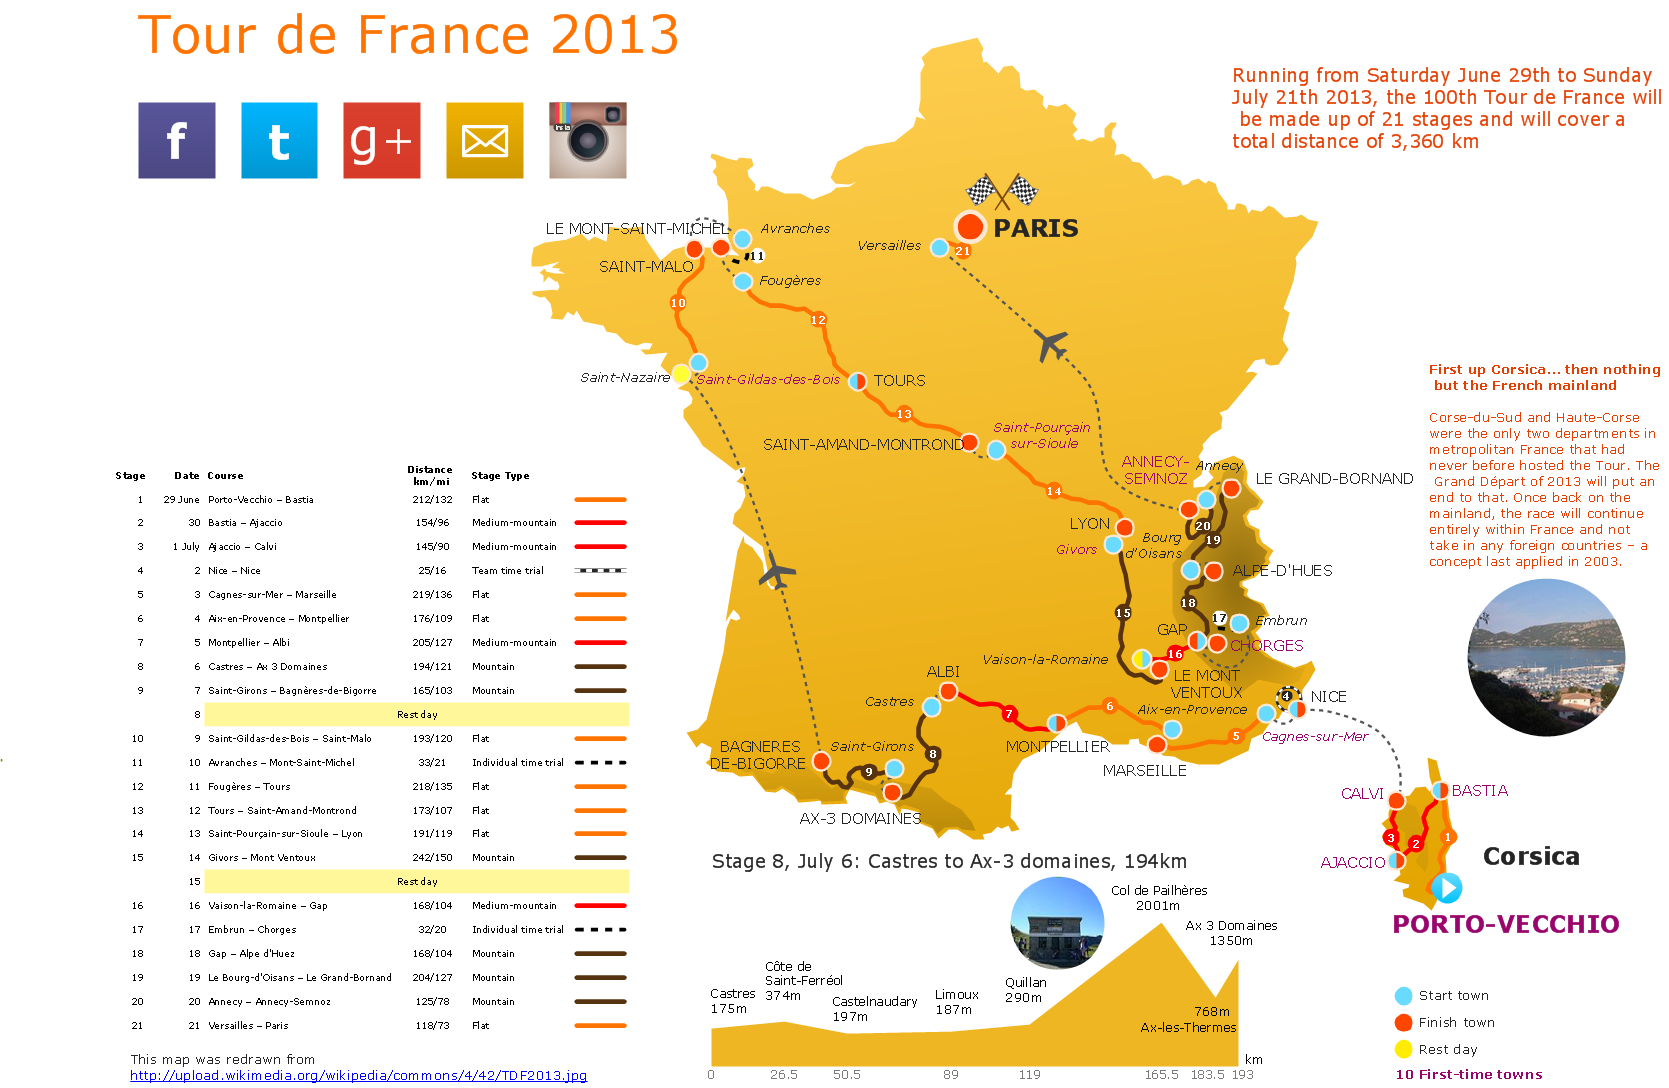
ConceptDraw collection of vector elements for infographics design.Best Tool for Infographic Construction
ConceptDraw is a best data visualization tool that will allow everyone to create rich infographics and visualizations quickly and easily.How to Create a Powerful Infographic When You do not Have a Designer
Create a powerful infographic, become inspired by the people with ConceptDraw.How to Create an Infographic
How to Create an Infographic? It’s very easy! All what you need is a powerful infographic software. Never before creation of Infographics wasn’t so easy as now with Typography Infographics Solution from the “What are Infographics” Area for ConceptDraw Solution Park.How to draw Metro Map style infographics? (Los Angeles)
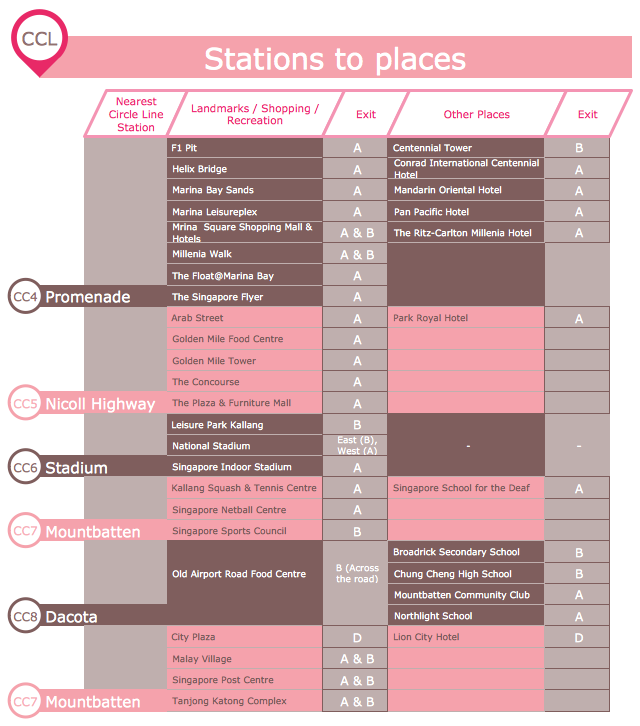
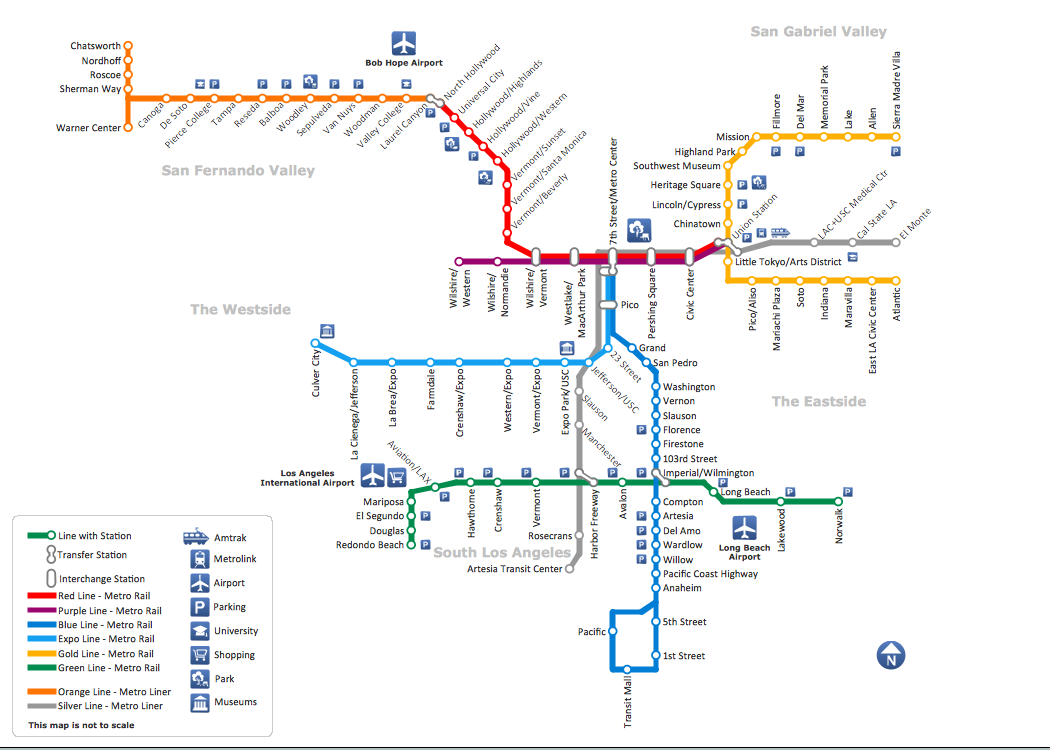
Tool to draw Metro Map styled inforgraphics. Los Angeles Metro Rail and Liner sample.This is a one-click tool to add stations to the map. It lets you control the direction in which you create new stations, change lengths, and add text labels and icons. It contains Lines, Stations, and Landmarks objects.
How to draw Metro Map style infographics? (New York)
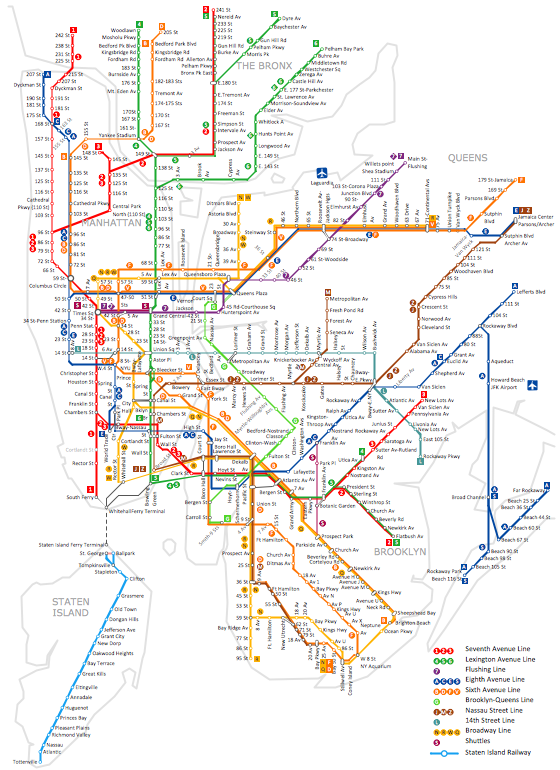
How to draw Metro Map style infographics of New York subway.New York Subway has a long history starting on October 27, 1904. Since the opening many agencies have provided schemes of the subway system. At present time are 34 lines in use. This page present New York City subway map construct with Metro Map Solution in Conceptdraw PRO software. This is a one-click tool to add stations to the map. It lets you control the direction in which you create new stations, change lengths, and add text labels and icons. It contains Lines, Stations, and Landmarks objects
How to Make an Infographic
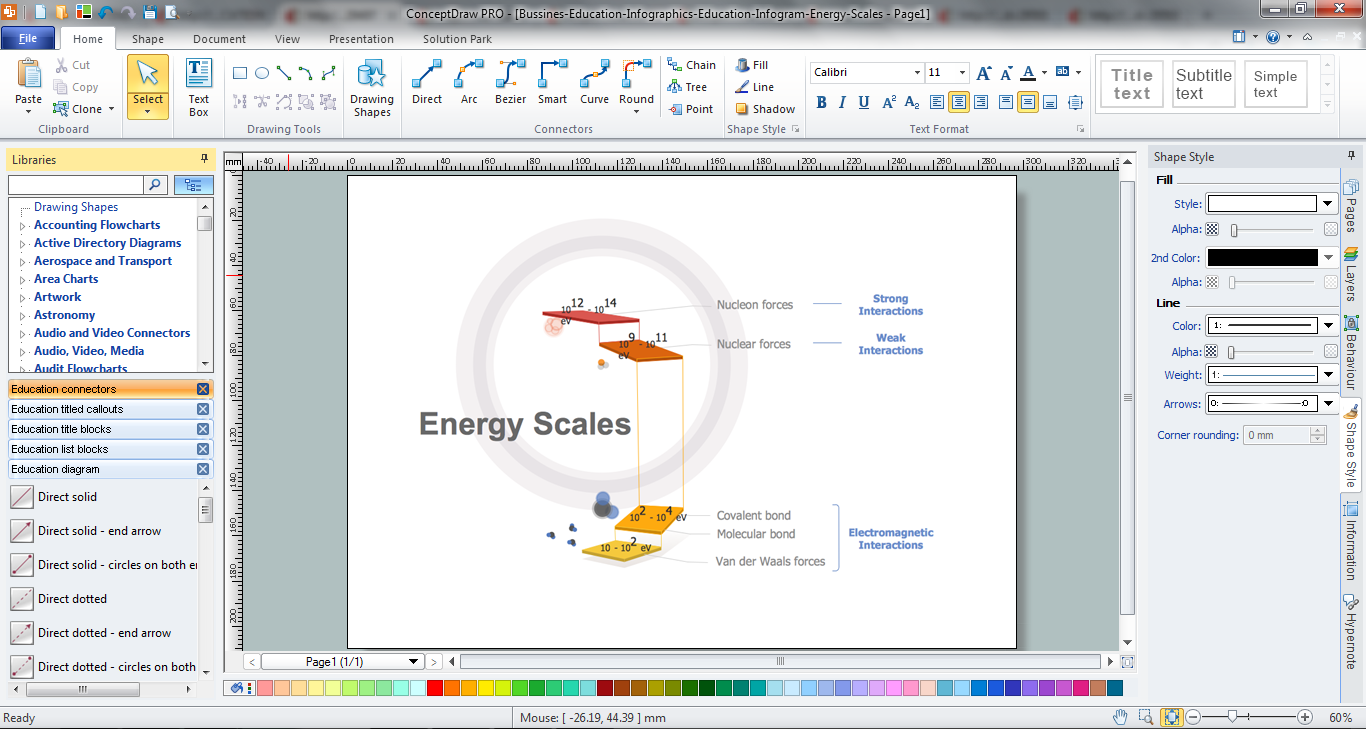
How to Make an Infographic quick and easy? The perfect way is to use the ConceptDraw PRO diagramming and vector drawing software extended with Education Infographics Solution from the Business Infographics Area.Infographic Maker
Infographic is a visual way of representing various information, data, knowledge in statistics, geography, journalism, education, and much more areas. ConceptDraw PRO supplied with Pictorial Infographics Solution from the “What are Infographics” Area, provides a set of powerful pictorial infographics tools. Thanks to them it is the best Infographic Maker.Make an Infographic
You want to make an infographic and need the useful and convenient drawing tools for this? In this case the ConceptDraw PRO software extended with Education Infographics Solution is a real godsend for you.HelpDesk
How to Create a Typography Infographic Using ConceptDraw PRO
Infographics are a good way to visually share knowledge , to communicate information and illustrate a message. Typography Infographics can help to present at a glance a large pack of complex information in a clear and vivid manner. Designers use the elements of typography Infographics to compose a graphic presentation of an information that is intended to depict the information behind the numbers in a creative and interesting visual way. Each infographic element is used to depict and explain an idea of the current portion of information. Each infographic element must inform its message clearly. ConceptDraw PRO provides the ability to design different kinds of typography infographics. You can use ConceptDraw Typography Infographics solution to create typography infographics effortlessly and quickly using the special set of vector stencils libraries.HelpDesk
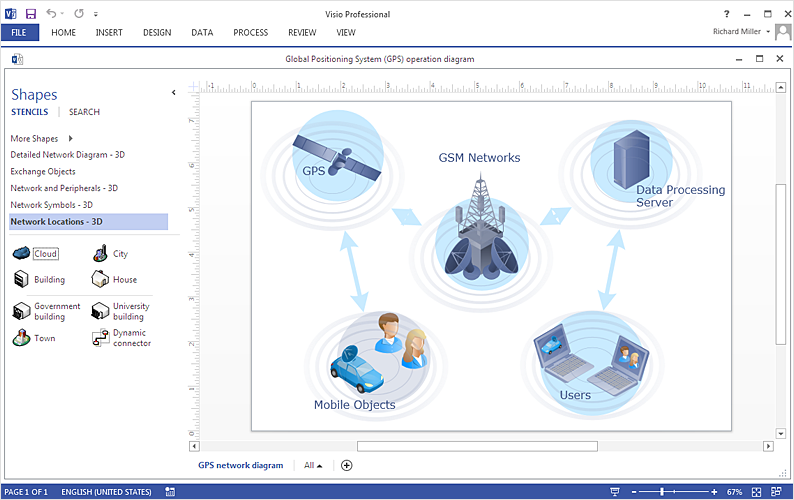
How To Create a MS Visio Telecommunication Network Diagram Using ConceptDraw PRO
Telecommunication network consists from computers and telecommunication equipment, providing information exchange between network elements. The main purpose of telecommunication networks is to provide access to distributed resources. Making a telecommunication network diagram involves many specific elements of telecommunication technology that can be managed using ConceptDraw PRO. ConceptDraw PRO allows you to easily create telecommunication network diagram of any complexity and then export it to MS Visio VSDX and VDX file. Thus you can create a pack of telecommunication network documentation, that you will easily communicate with other specialists, who use MS Visio.HelpDesk
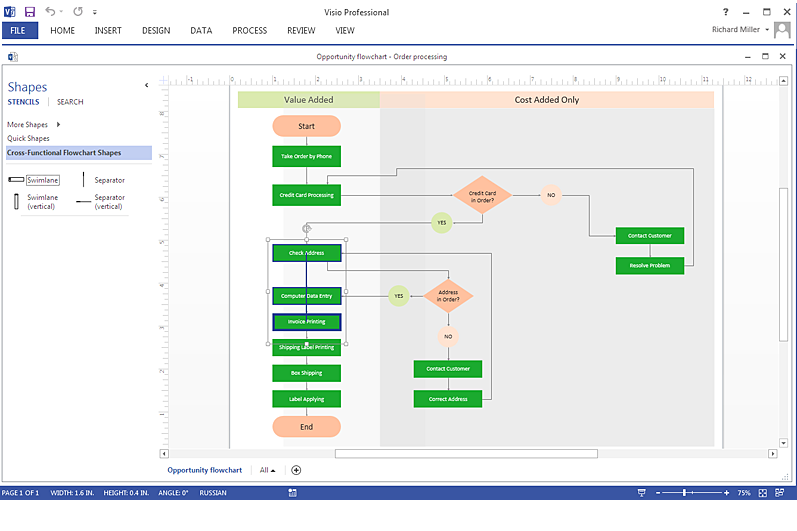
How To Create a MS Visio Cross-Functional Flowchart Using ConceptDraw PRO
Cross-functional is a process involving several functional layers. Such processes typically cause the most problems, and therefore, is the most potential for improvement. Cross-functional business processes are usually illustrate the processes of product development, commercial proposal development, the order execution process - everything, that involves several departments. The package of possible improvements - is the task of re-engineering. To illustrate the cross-functional processes often use cross-functional flowchart is often used to illustrate the cross-functional processes. ConceptDraw PRO allows you to easily create cross-functional flowchart. Then, you can export it to MS Visio VSDX or VDX format and successfully share it with your colleagues still using MS Visio.Spatial infographics Design Elements: Location Map
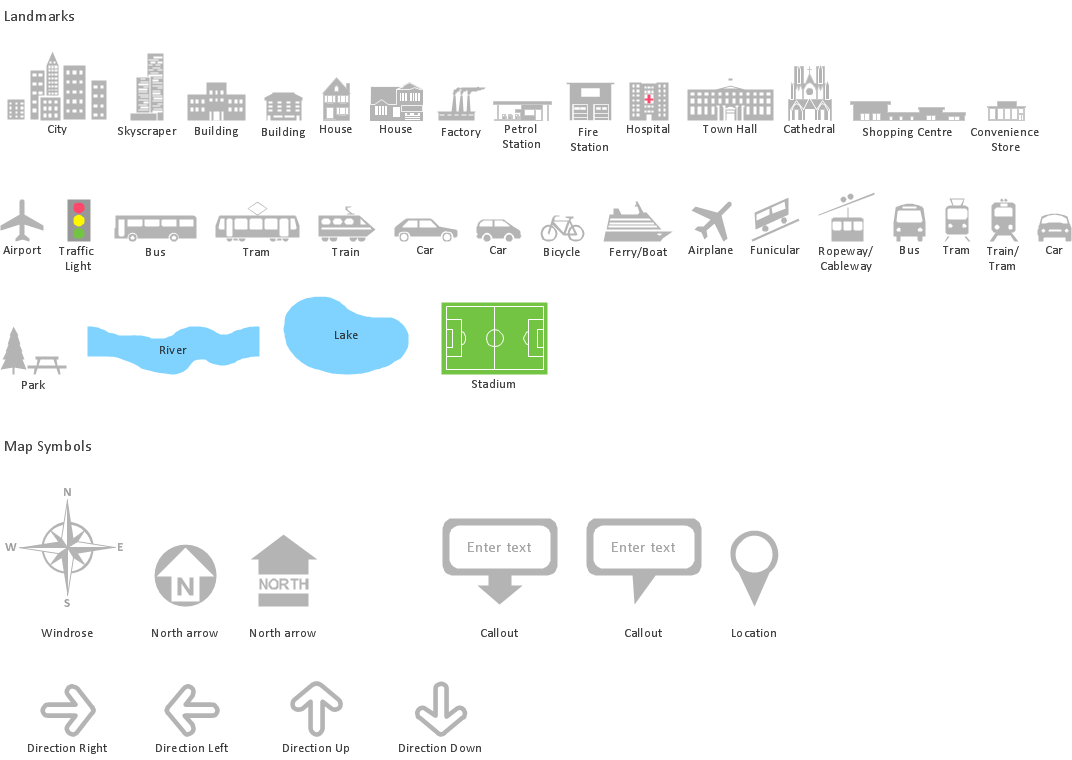
Infographic Design Elements for visually present various geographically distributed information.- How To Create a MS Visio Data-driven Infographics Using ...
- Marketing Plan Infographic | Spatial infographics Design Elements ...
- What are Infographic Area | How To Create a MS Visio Data-driven ...
- How to draw Metro Map style infographics ? (Los Angeles) | How to ...
- How to draw Metro Map style infographics ? (New York) | Subway ...
- How to Add Data-driven Infographics to a MS Word Document Using ...
- Pictorial Chart | Design Pictorial Infographics . Design Infographics ...
- Timeline Examples | How to Make a Timeline | Project Timeline ...
- How to Create Data-driven Infographics | How to Add Data-driven ...
- What are Infographic Area | PM Planning | Visio Exchange | Make A ...
- Visio Stencils Directional Maps
- How to Convert Visio Custom Library to ConceptDraw PRO | What ...
- Network Security Devices | Map Infographic Design | Subway ...
- Social Media Marketing Infographic | Management Consultant | Visio ...
- Design elements - Marketing backgrounds | ConceptDraw PRO ...
- Flow Chart Creator | Block Diagram Creator | Map Infographic ...
- Process Flowchart | How to draw Metro Map style infographics ...
- What are Infographic Area | Product Overview | ConceptDraw PRO ...
- Spatial infographics Design Elements: Continental Map | Best Tool ...
- Timeline Examples | Project Timeline | How to Make a Timeline ...
- ERD | Entity Relationship Diagrams, ERD Software for Mac and Win
- Flowchart | Basic Flowchart Symbols and Meaning
- Flowchart | Flowchart Design - Symbols, Shapes, Stencils and Icons
- Flowchart | Flow Chart Symbols
- Electrical | Electrical Drawing - Wiring and Circuits Schematics
- Flowchart | Common Flowchart Symbols
- Flowchart | Common Flowchart Symbols
