HelpDesk
How to Create a CCTV Diagram

CCTV diagram should include the scheme of strategic placement of video cameras, which capture and transmit videos to either a private network of monitors for real-time viewing or to a video recorder for later reference. CCTV is commonly used for surveillance and security purposes. Using ConceptDraw DIAGRAM with the Security and Access Plans Solution lets you create professional looking video surveillance CCTV system plans, security plans, and access schemes.
HelpDesk
How to Make Network Diagram

Create Block Diagram

Create block diagrams, electrical circuit diagrams, schematics, and more in minutes with ConceptDraw DIAGRAM.
Network Diagram Software Logical Network Diagram


HelpDesk
How to Create a Fishbone (Ishikawa) Diagram Quickly
 Diagram Quickly")
HelpDesk
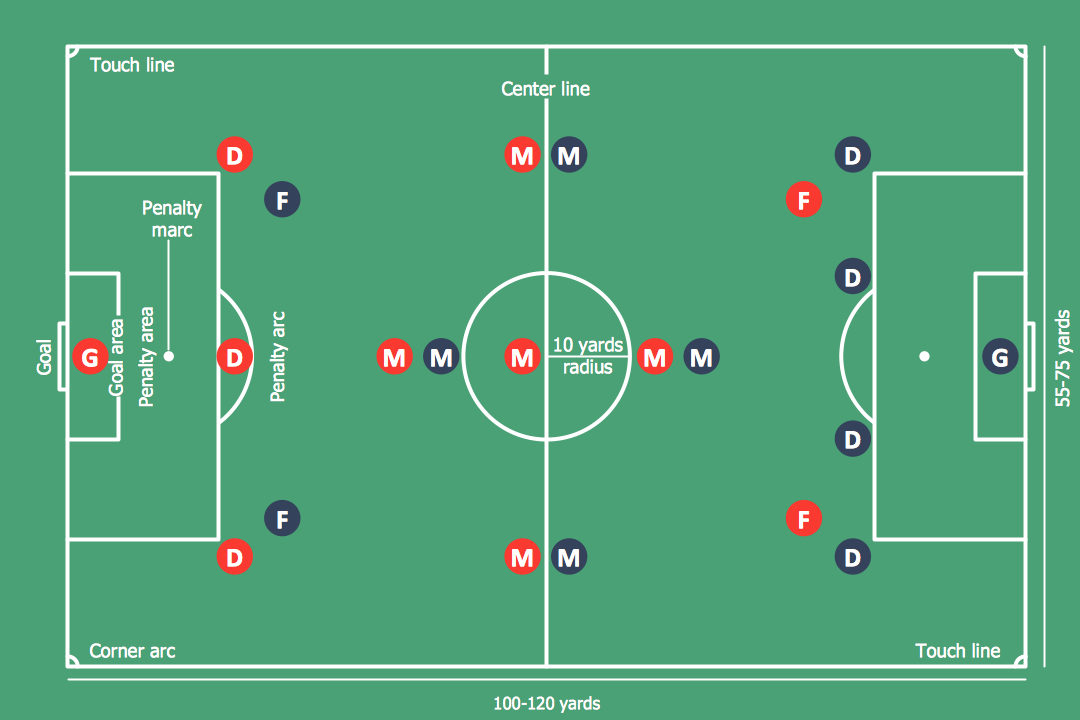
How to Make Soccer Position Diagram
Network Gateway Router

Special libraries of highly detailed, accurate shapes and computer graphics, servers, hubs, switches, printers, mainframes, face plates, routers etc.
Basic Network Diagram

- Design elements - Data Flow Diagram (DFD) | How to Create ...
- How To create Diagrams for Amazon Web Services architecture ...
- Basic Diagramming | Create Block Diagram | Best Multi-Platform ...
- Business Diagram Software | Create Block Diagram | IDEF0 ...
- How to Create a Pie Chart | Pyramid Diagrams | Pyramid diagram ...
- Best Multi-Platform Diagram Software | Create Graphs and Charts ...
- Simple & Fast Diagram Software | Create Flow Chart on Mac | Easy ...
- Flow Diagram Software | Create Flow Chart on Mac | Business ...
- Bubble diagram - Employer objectives | How to Create a Bubble ...
- How To Draw Building Plans | Network Diagram Examples | Network ...
- Basic Diagramming | Block Diagrams | Create Block Diagram |
- How to Create a Social Media Flowchart | Business Diagram ...
- Block diagram - Automotive HVAC system | Create Block Diagram ...
- Create Block Diagram | Block Diagrams | ConceptDraw Arrows10 ...
- UML Class Diagram Notation | How to create a UML Diagram | UML ...
- Create Flow Chart on Mac - Conceptdraw.com
- How to Create a Social Media DFD Flowchart | Venn diagram ...
- Basic Diagramming | Create Block Diagram | Block Diagrams |
- Create Block Diagram | ConceptDraw Arrows10 Technology ...
- How to Create Cisco Network Diagram Using ConceptDraw ...
- ERD | Entity Relationship Diagrams, ERD Software for Mac and Win
- Flowchart | Basic Flowchart Symbols and Meaning
- Flowchart | Flowchart Design - Symbols, Shapes, Stencils and Icons
- Flowchart | Flow Chart Symbols
- Electrical | Electrical Drawing - Wiring and Circuits Schematics
- Flowchart | Common Flowchart Symbols
- Flowchart | Common Flowchart Symbols