This site uses cookies. By continuing to browse the ConceptDraw site you are agreeing to our Use of Site Cookies.
HelpDesk

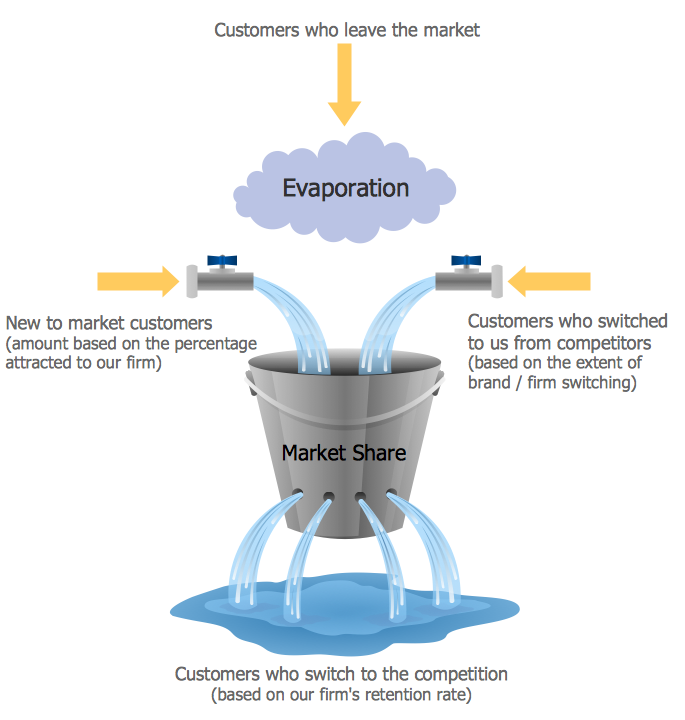
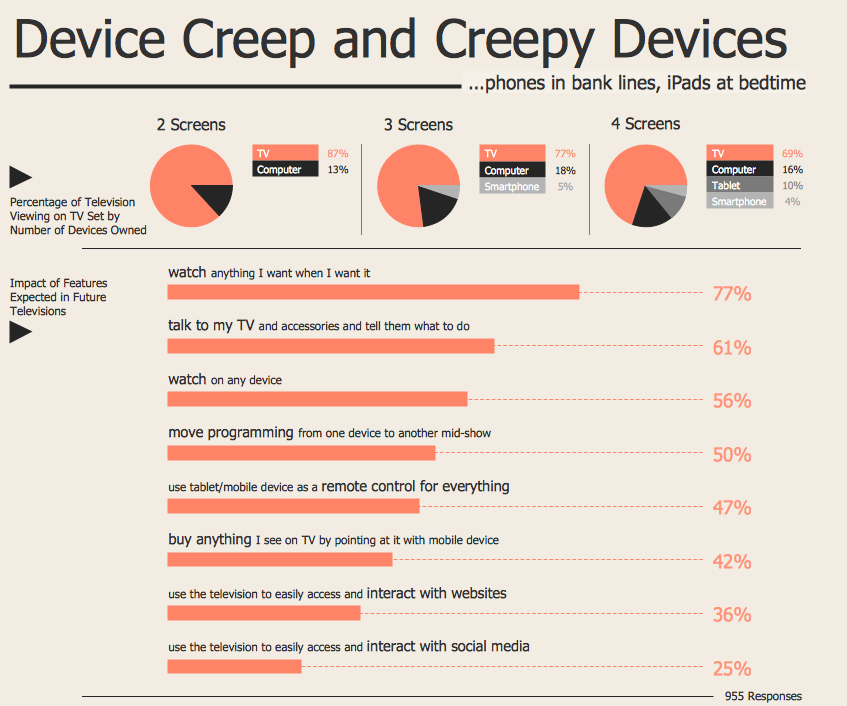
How to Create Marketing Infographics

Marketing Infographics are used to quickly communicate a marketing message, to simplify the marketing presentation of large amounts of data, to see data patterns and relationships, and to monitor changes in variables over time. It can contain bar graphs, pie charts, histograms, line charts, e.t.c. Marketing infographics display a lot of information in a single, visually-appealing picture. ConceptDraw DIAGRAM can be used as a tool for creating marketing infographics. It allows you to draw marketing infographics quickly and easily using the special templates and vector stencils libraries.

marketing, process, chart, Marketing Charts, Marketing Diagrams,  solution park Marketing

marketing, process, chart, Marketing Charts, Marketing Diagrams,  solution park
This solution extends ConceptDraw DIAGRAM and ConceptDraw MINDMAP with Marketing Diagrams and Mind Maps (brainstorming, preparing and holding meetings and presentations, sales calls).

Flowchart Marketing Process. Flowchart Examples

This sample shows the Flowchart that displays the layout and work flow of the cloud marketing platform. This diagram has a style of the marketing brochure. This style displays the central product that is related to the other issues.
Using the ready-to-use predesigned objects, samples and templates from the Flowcharts Solution for ConceptDraw DIAGRAM you can create your own professional looking Flowchart Diagrams quick and easy.

Social Media Marketing Infographic

How to create Social Media Marketing Infographic? It’s very easy! All that you need is a powerful marketing infographics software. Never before creation of Social Media Marketing Infographic wasn’t so easy as now with tools of Marketing Infographics Solution from the Business Infographics Area for ConceptDraw Solution Park.

How to Create a Social Media DFD Flowchart

Interactive tool helps you create a social media DFD flowchart to find the appropriate response to social media mentions quickly.
It allows companies to be more effective in timely messaging thanks to the ability for rapid response to a customer′s post in social media. This saves budget for companies who use social media for promoting and as a lead generation tool.
HelpDesk

How to Add a Circle-spoke Diagram to PowerPoint

ConceptDraw DIAGRAM can be used as a tool for creating circle spoke diagrams along with other marketing diagrams. ConceptDraw DIAGRAM allows you to make an MS PowerPoint Presentation from your marketing diagrams in a few simple steps.
HelpDesk

How to Create Data-Driven Infographics

Data-driven infographics are used in wildly disparate areas of business and commerce. To make effective Data-driven infographics, it's useful to have a wide variety of graphical elements — icons, clipart, stencils, charts, and graphs — to illustrate your diagram. ConceptDraw Data-driven Infographics solution provides all the tools you need to present data as described by this article — as well as the charts mentioned previously, you can find histograms, divided bar charts, ring charts, line graphs, and area charts — meaning you can find the perfect medium for displaying a certain type of data. It allows you to draw data-driven infographics quickly and easily using the special templates and vector stencils libraries. It can be used to quickly communicate a message, to simplify the presentation of large amounts of data, to see data patterns and relationships, and to monitor changes in variables over time.

How to Make SWOT Analysis in a Word Document

A SWOT Analysis is a popular strategic planning tool used to evaluate the Strengths, Weaknesses, Opportunities, and Threats involved in any businesses. You can export your SWOT mind map into a MS Word document, which makes using SWOT mind map easier if you need to collaborate it with other people.
ConceptDraw products across any platform, meaning you never have to worry about compatibility again. ConceptDraw MINDMAP allows you to make SWOT analysis on PC or macOS operating systems.

How To Create a FlowChart using ConceptDraw

Have you ever needed a flowchart, but did not have the time or tools to build one? Rapid Draw allows you to build a professional flowchart quickly and easily. You have the ability to add your own shapes to Rapid Draw’s built in shape library.

How to Create a Pyramid Diagram

ConceptDraw Pyramid Diagram software allows drawing column charts using predesigned objects or drawing tools. In ConceptDraw Pyramid Diagram software you can find a complete set of column chart tools and objects.
HelpDesk

How to Create a Sales Flowchart

A Sales flowchart is a specialized type of flowchart. With the help of a sales flowchart, you can visually describe tasks, documents, people responsible for execution at each stage of the sales process. For most commercial organizations, the sales process is inherent to its existence and ability to create profit. Although each company will achieve this aim in its own way, the core selling process remains similar throughout — a potential buyer or prospective customer exchanges money with an organization in return for goods or services. Despite this rather simplistic definition, there exists a huge scope as to which approach is taken. Indeed, it is not uncommon for the sales division to be the largest within a corporate structure, employing a team of salespeople, analysts, and the sales managers, who are in charge of sales division operations. The practical applications of sales process flowcharts are numerous and wide-ranging. At the sales level, you might map the process of customer interact
HelpDesk

How to Make an Ansoff Matrix Template

Ansoff Matrix is a business strategic management tool that helps a business determine its product and market growth strategy. Ansoff matrix has four sections to show each impacting ways that businesses can grow. Using the Ansoff Matrix enables determining the current position of any business in the industry and choose the direction of its growth, which would provide the most competitive position. While Ansoff Matrix is most commonly used as a business planning tool it can be used also for personal development. You can make the Ansoff Matrix template for your organization using ConceptDraw DIAGRAM Matrices solution.

What is SWOT Analysis in Marketing

The ConceptDraw DIAGRAM and MINDMAP software allow professional to make well-designed SWOT matrix in minutes. The SWOT Analysis solution includes the SWOT matrix samples, and templates that allow users create own SWOT diagram.
HelpDesk

How To Make Visio Circle-Spoke Diagram

Circle-Spoke Diagram consists of a central round balloon, which is circled with other balloons as a ring. The Circle-Spoke Diagram is usually used in marketing. It shows the relationships between entities and the central element. Circle-Spoke Diagram can be used in marketing documentation and presentations. ConceptDraw DIAGRAM allows you to easily create marketing charts of any complexity, including the circle-spoke diagram and then make an MS Visio file from your diagram in a few simple steps. You can easily design your business documentation and share it easily with MS Visio users.
HelpDesk

How to Make a Web Page from Infographics

Create your own original marketing illustrations and infographics, presentation slides, website, and blog pages using ConceptDraw DIAGRAM.

How To Create a Killer Presentation

What’s the difference between a great and bad presentation? With conceptdraw you will create only great presentations.
HelpDesk

How to Create a Venn Diagram

Venn diagrams were invented by John Venn as a method of depicting relationships between different components. A Venn diagram consists of two or more circles. Each circle represents a specific group or set. The entities which are depicted by circles generally have some common characteristics. A Venn Diagram shows all the possible logical relations between these entities. Any properties that belong to more than one set should be indicated in the sections where the circles overlap. A Venn Diagram can be useful to visually summarize the status and future viability of a project. ConceptDraw DIAGRAM allows you to make Venn diagrams using the Venn Diagrams solution.

Market Chart

ConceptDraw DIAGRAM is a powerful diagramming and vector drawing software. Each Market Chart designed in it is professional looking, attractive and successful in using thanks to the Marketing Diagrams Solution included in Marketing Area of ConceptDraw Solution Park.

Internet Marketing Infographic

ConceptDraw DIAGRAM extended with Marketing Infographics Solution from the Business Infographics Area is the best software for creating Internet Marketing Infographic of any complexity in minutes. Make sure in it right now!