Donut Chart
ConceptDraw PRO diagramming and vector drawing software offers the Pie Charts solution from the Graphs and Charts area which includes the tools for quick and easy designing any kind of Donut Chart.Risk Diagram (Process Decision Program Chart)
Analyze each identified action separately in the tree of all actions and then develop a preventive action in response to potential obstacles or circumstances have been identified as a risk.The PDPC determines the risks when corrective action is not performed correctly. Also, it helps develop descriptions for preventive actions at the level of execution.
Bubble Charts
Bubble Charts are convenient way to visualize ideas and concepts by organizing them in a hierarchy. To show the importance of ideas you can use different bubble sizes and colors. ConceptDraw PRO diagramming and vector drawing software extended with Bubble Diagrams Solution from the "What is a Diagram" Area affords you the easiest and fastest way for designing professional looking Bubble Charts.HelpDesk
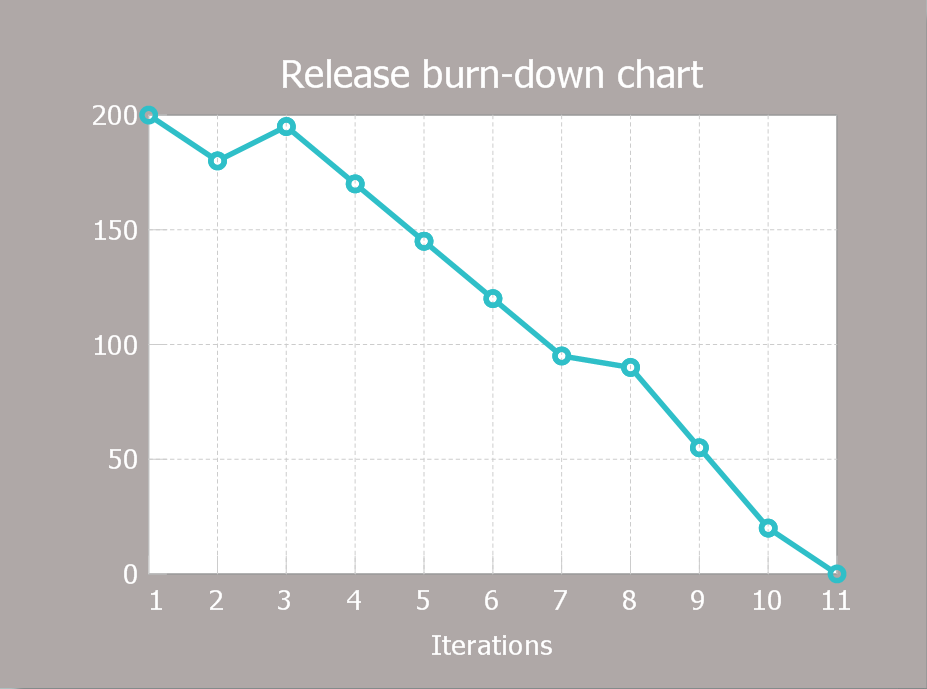
How to Create a Release Burn-Down Chart Using ConceptDraw PRO
The Agile methodology provides project teams the ability to quickly adapt the project to the current situation and thus achieve maximum productivity. According the Scrum method the steps needed to fulfill the project goal breaks down by using short sprints or iterations. The iterations together with an extensive collaboration can increase productivity by better understanding the entire flow of a project. A release burn-down chart is used to track a progress on a Scrum project. The ConceptDraw Scrum Workflow Solution makes it easy for Agile project team to build any professional Scrum diagram such as a Release velocity chart, Release burn-down chart, Sprint burn-down chart, or a Team velocity chart.Six Markets Model Chart
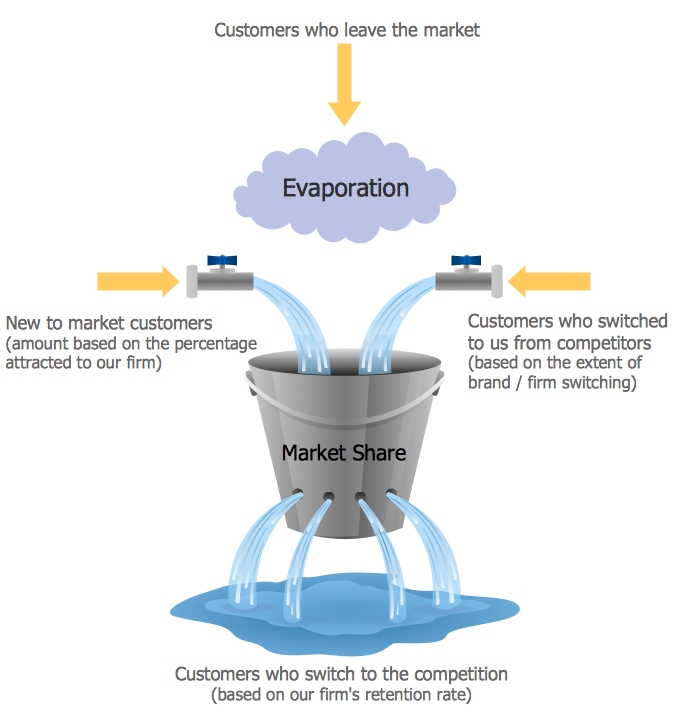
This sample shows the Six Markets Model Chart. It was created in ConceptDraw PRO diagramming and vector drawing software using the Marketing Diagrams Solution from the Marketing area of ConceptDraw Solution Park.The six markets model defines six markets that take the central place in the relationship marketing: internal markets, supplier markets, recruitment markets, referral markets, influence markets and customer markets. The six markets model allows the organization to analyze the stakeholders and key market domains that can be important to it.
Process Flow Chart Examples
Process Flow Chart is a visual illustration of overall flow of activities in producing a product or service. How do you make a Process Flow Chart usually? Drawing process flow charts, diagrams and maps is quite complex and lengthy process, especially if you draw free-hand. But now thanks to the ConceptDraw PRO diagramming and vector drawing software extended with Flowcharts solution from the "What is a Diagram" area of ConceptDraw Solution Park this process became simple and fast. A confirmation of this can serve many Process Flow Chart examples included in Flowcharts solution.Seating Chart Template
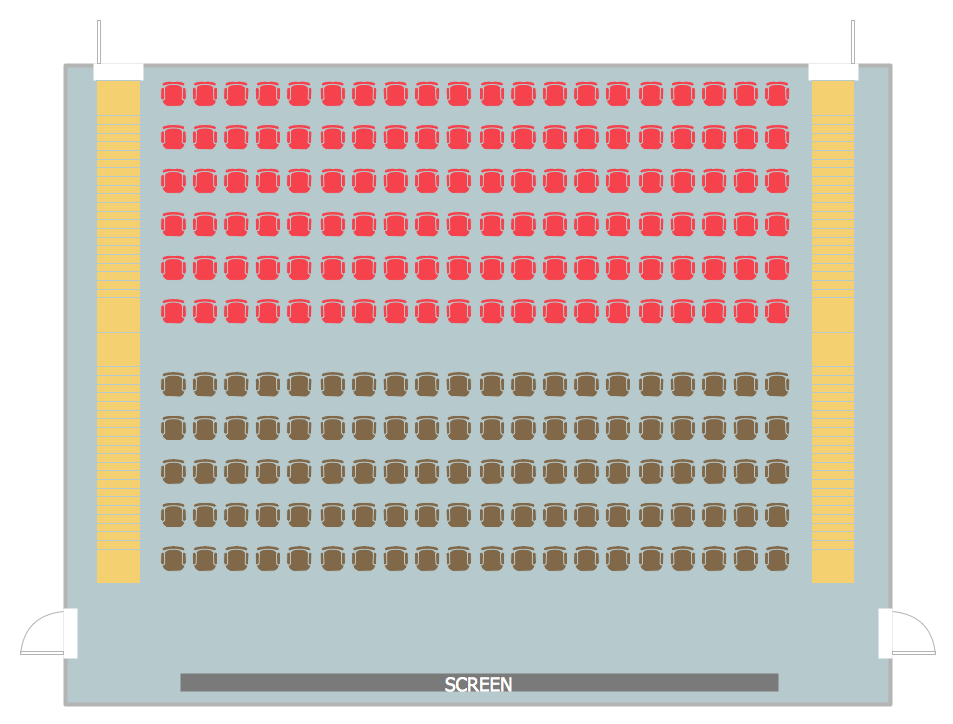
Seating chart developing is necessity for constructing and building the cinemas, theaters, banquet halls, auditoriums, and other premises for accommodation a large number of people. Seating chart template can help you design professional looking seating plan. ConceptDraw PRO diagramming and vector drawing software recommends you to use the Seating Plans solution from the Building Plans area for designing the seating charts.Flowchart Example: Flow Chart of Marketing Analysis
An example flowchart of marketing analysis shows main steps you have to challenge writing a marketing analysis.Market Chart
ConceptDraw PRO is a powerful diagramming and vector drawing software. Each Market Chart designed in it is professional looking, attractive and successful in using thanks to the Marketing Diagrams Solution included in Marketing Area of ConceptDraw Solution Park.Chart Audit
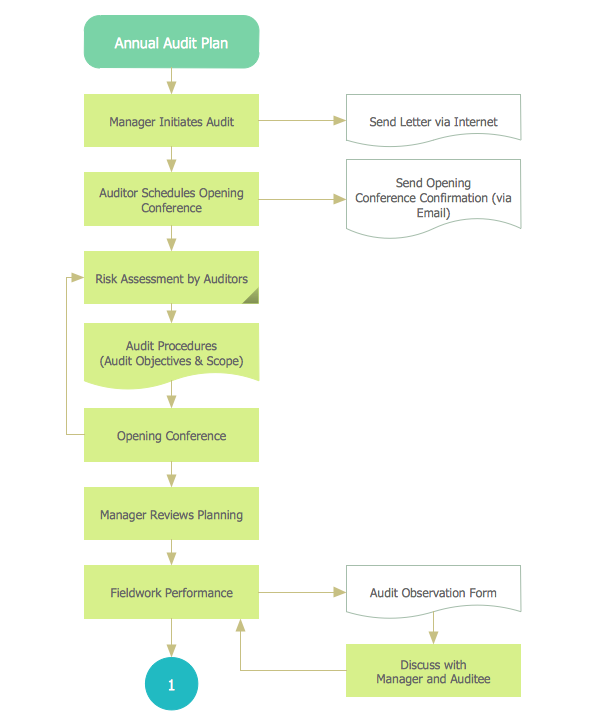
ConceptDraw PRO enhanced with Audit Flowcharts solution from the Finance and Accounting area of ConceptDraw Solution Park is a powerful diagramming and vector drawing software for designing professional looking Chart Audit of any complexity.Chart Audit is incredibly convenient for representing important information about audit process and audit planning process. It also helps auditors to define the problem areas and to elaborate the ways of their solving and effectiveness improvement.
 Area Charts
Area Charts are used to display the cumulative totals over time using numbers or percentages; or to show trends over time among related attributes. The Area Chart is effective when comparing two or more quantities. Each series of data is typically represented with a different color, the use of color transparency in an object’s transparency shows overlapped areas and smaller areas hidden behind larger areas.
Organizational Chart Templates
ConceptDraw offers you a number of ready-made organizational chart templates which you can use in your drawing. They are grouped in topical sets as organizational chart template files.Use the Organizational Charts Solution for ConceptDraw PRO to create your own Organizational Charts of any complexity quick, easy and effective.
The Organizational Charts designed with ConceptDraw PRO are vector graphic documents and are available for reviewing, modifying, converting to a variety of formats (image, HTML, PDF file, MS PowerPoint Presentation, Adobe Flash or MS Visio XML), printing and send via e-mail in one moment.

Sample Pictorial Chart. Sample Infographics
Sample Pictorial Chart - Pictorial Infographics solution provides easy-to-use design infographics drawing tools, large collection of different sample infographics and infograms, sample pictorial chart and templates to be filled in, and 10 libraries with great quantity of predesigned vector pictograms.Use Pictorial Infographics solution to draw your own design pictorial infographics documents quick and easy.
Marketing Analysis Diagram
An example of marketing analysis diagram, can be used to analyse product market and define marketing strategy.How to Create a Cross Functional Flow Chart
If neither of 45 vector shapes of the Cross-Functional Flowcharts solution don't fit your needs, you will want to learn How to create a unique Cross-Functional flowchart.ConceptDraw Arrows10 Technology - This is more than enough versatility to draw any type of diagram with any degree of complexity.
Drawing software lets you to make horizontal and vertical, audit, opportunity and many more flowcharts.
- How To Achieve A Goal In Life By Flow Chart
- How to Draw an Organization Chart | Organizational Structure ...
- Program to Make Flow Chart | Basic Diagramming | Circular Arrows ...
- Project management life cycle - Flowchart | Program to Make Flow ...
- Pie Chart Examples and Templates | Sample Pictorial Chart . Sample ...
- Social Brand Strategy | Competitor Analysis | Pyramid Chart ...
- Chart Of Scope Of Marketing
- How to Draw an Organization Chart | Examples of Flowcharts, Org ...
- Gantt charts for planning and scheduling projects | Project Timeline ...
- Organizational Charts | Examples of Flowcharts, Org Charts and ...
- Organizational Communication Flow Chart
- Examples of Flowcharts, Org Charts and More | Business Report Pie ...
- Marketing Charts | Marketing Organization Chart | Marketing ...
- Column Chart Software | Examples of Flowchart | Sales Growth. Bar ...
- Gantt Chart Templates | Business Processes | Examples of ...
- ConceptDraw PRO - Organizational chart software | Organizational ...
- Gantt chart examples | Basic Flowchart Symbols and Meaning ...
- ConceptDraw PRO - Organizational chart software | Restaurant ...
- Life cycle analysis - Ring chart | Community life cycle matrix - Ring ...
- Daily Schedule Chart
- ERD | Entity Relationship Diagrams, ERD Software for Mac and Win
- Flowchart | Basic Flowchart Symbols and Meaning
- Flowchart | Flowchart Design - Symbols, Shapes, Stencils and Icons
- Flowchart | Flow Chart Symbols
- Electrical | Electrical Drawing - Wiring and Circuits Schematics
- Flowchart | Common Flowchart Symbols
- Flowchart | Common Flowchart Symbols


