The Data flow diagram (DFD) example "Payment for goods using UPS code scanner" shows data flow in process of payment for goods in the shop using the MaxiCode scanner.
"MaxiCode is a public domain, machine-readable symbol system originally created and used by United Parcel Service. Suitable for tracking and managing the shipment of packages, it resembles a barcode, but uses dots arranged in a hexagonal grid instead of bars. MaxiCode has been standardised under ISO/ IEC 16023.
A MaxiCode symbol (internally called "Bird's Eye", "Target", "dense code", or "UPS code") appears as a 1 inch square, with a bullseye in the middle, surrounded by a pattern of hexagonal dots. It can store about 93 characters of information, and up to 8 MaxiCode symbols can be chained together to convey more data. The centered symmetrical bullseye is useful in automatic symbol location regardless of orientation, and it allows MaxiCode symbols to be scanned even on a package traveling rapidly." [MaxiCode. Wikipedia]
This example of data flow diagram (Gane & Sarson notation) was created using the ConceptDraw PRO diagramming and vector drawing software extended with the Data Flow Diagrams solution from the Software Development area of ConceptDraw Solution Park.
DFD
---payment-for-goods-using-ups-code-scanner.png--diagram-flowchart-example.png)
HelpDesk
How to Create a Data Flow Diagram using ConceptDraw PRO
 example")
The vector stencils library "DFD, Yourdon and Coad notation" contains 22 DFD elements.
Use it for drawing data flow diagrams (DFD) using Yourdon/ DeMarco notation in the ConceptDraw PRO diagramming and vector drawing software extended with the Data Flow Diagrams solution from the Software Development area of ConceptDraw Solution Park.
Use it for drawing data flow diagrams (DFD) using Yourdon/ DeMarco notation in the ConceptDraw PRO diagramming and vector drawing software extended with the Data Flow Diagrams solution from the Software Development area of ConceptDraw Solution Park.
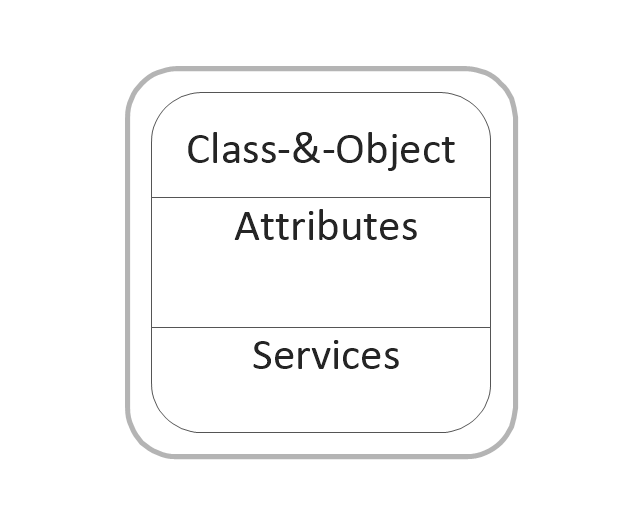
Class and object
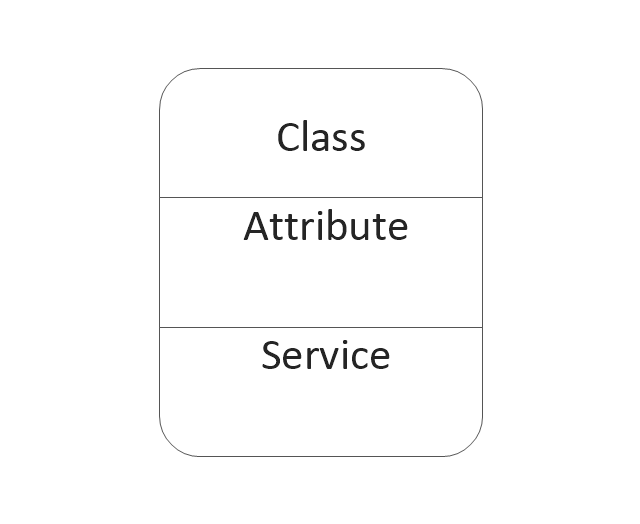
Class
Object state
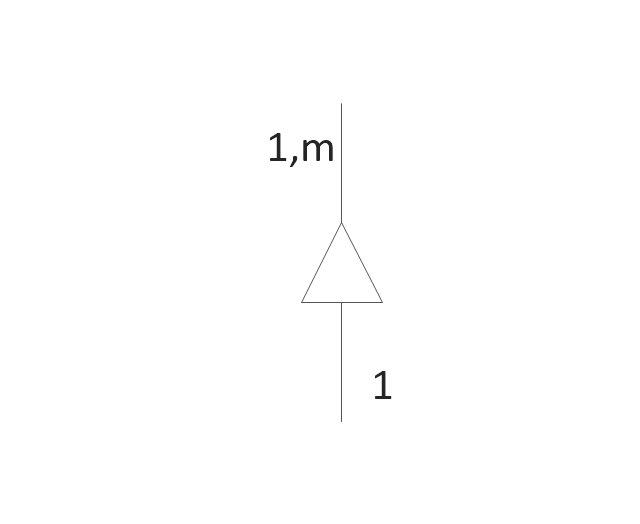
Generalization and specialization structure

Whole-part structure
Condition
Loop
External interactor
Data process
Multiple process
State
Multi-state
Stop state

Stop state2
Process
Process (offset)
-dfd,-yourdon-and-coad-notation---vector-stencils-library.png--diagram-flowchart-example.png)
Center to center

Center to center #2

Loop on center
Data store
Instance

Message

This example was redesigned from the Wikipedia file: LastResortHotel BookRoom Process.png. [en.wikipedia.org/ wiki/ File:LastResortHotel_ BookRoom_ Process.png]
This file is licensed under the Creative Commons Attribution-ShareAlike 3.0 License. [creativecommons.org/ licenses/ by-sa/ 3.0/ ]
"Event partitioning is an easy-to-apply systems analysis technique that helps the analyst organize requirements for large systems into a collection of smaller, simpler, minimally-connected, easier-to-understand ‘mini systems’ / use cases. ...
Defining requirements.
Single process in a fictitious hotel using data flow diagram notation.
Single use case in a fictitious hotel using use case diagram notation.
This approach helps the analyst to decompose the system into ‘mentally bite-sized’ mini-systems using events that require a planned response. The level of detail of each response is at the level of ‘primary use cases’. Each planned response may be modelled using DFD notation or as a single use case using use case diagram notation.
The basic flow within a process or use case can usually be described in a relatively small number of steps, often fewer than twenty or thirty, possibly using something like ‘structured English’. Ideally, all of the steps would be visible all at once (often a page or less). The intention is to reduce one of the risks associated with short-term memory, namely, forgetting what is not immediately visible (‘out of sight, out of mind’). ...
Single process in a fictitious hotel using data flow diagram notation." [Event partitioning. Wikipedia]
The DFD example "Last resort hotel book room process" was created using the ConceptDraw PRO diagramming and vector drawing software extended with the Data Flow Diagrams solution from the Software Development area of ConceptDraw Solution Park.
DFD

The vector stencils library "DFD, Gane-Sarson notation" contains 12 DFD elements.
Use it for drawing data flow diagrams (DFD) using Gane-Sarson notation in the ConceptDraw PRO diagramming and vector drawing software extended with the Data Flow Diagrams solution from the Software Development area of ConceptDraw Solution Park.
Use it for drawing data flow diagrams (DFD) using Gane-Sarson notation in the ConceptDraw PRO diagramming and vector drawing software extended with the Data Flow Diagrams solution from the Software Development area of ConceptDraw Solution Park.
External Entity
Process
Process w / Location
Data Store
Jump
Angled Connector
Angled Connector 2

Top to Bottom Variable
Bottom to Side
Side to Side
Side to Same Side

Top to Top Side
- Data Flow Diagram Symbols . DFD Library | Basic Flowchart ...
- How Many Symbol Use In Dfd
- Gane Sarson Diagram | Data Flow Diagram Symbols . DFD Library ...
- Data Flow Diagram Symbols . DFD Library | Entity Relationship ...
- Data Flow Diagram
- DFD , Yourdon and Coad notation - Template
- Symbols Used In Dfd Diagram
- Data Flow Diagram Symbols . DFD Library | Design Data Flow. DFD ...
- Gane Sarson Diagram | DFD , Gane-Sarson notation - Template ...
- Data Flow Diagram | Data Flow Diagram Symbols . DFD Library ...
- DFD Library System | Data Flow Diagram Symbols . DFD Library ...
- Basic Flowchart Symbols and Meaning | Data Flow Diagram ...
- Data Flow Diagram Symbols . DFD Library | Process Flowchart ...
- Data Flow Diagram Symbols . DFD Library | Process Flowchart ...
- Flowchart design. Flowchart symbols , shapes, stencils and icons ...
- Dfd Of Library System Using Gane And Sarson Symbol
- Booch OOD Diagram | Primary Symbols Of Dfd
- Symbol Used In Data Flow Diagram
- Dfd Connector Symbol
- DFD - Process of account receivable | Data Flow Diagram Process ...
- ERD | Entity Relationship Diagrams, ERD Software for Mac and Win
- Flowchart | Basic Flowchart Symbols and Meaning
- Flowchart | Flowchart Design - Symbols, Shapes, Stencils and Icons
- Flowchart | Flow Chart Symbols
- Electrical | Electrical Drawing - Wiring and Circuits Schematics
- Flowchart | Common Flowchart Symbols
- Flowchart | Common Flowchart Symbols