Horizontal Org Flow Chart
This sample was created in ConceptDraw PRO diagramming and vector drawing software using the Organizational Charts Solution from the Management area of ConceptDraw Solution Park.The Organizational Chart is a diagram that shows the structure of the organization, different levels of management, hierarchy and the relationships of the organization parts.
Horizontal Flowchart
This sample was created in ConceptDraw PRO diagramming and vector drawing software using the Flowcharts solution from the What is a Diagram area of ConceptDraw Solution Park.A Flowchart is a graphically representation of the process, algorithm or the step-by-step solution of the problem. The Flowcharts have one or more starting and ending points. The geometric figures on the Flowcharts represent the steps of the process and are connected with arrows that show the sequence of the actions.
Horizontal Orgchart
The Organizational Chart is a diagram that shows the structure of the organization and the relationships of its parts. There are many ways to present the Organizational Chart. One of them is the Horizontal Organizational Chart: the parts of the diagram are arranged from left to right, or from right to left.This sample was created in ConceptDraw PRO diagramming and vector drawing software using the Organizational Charts Solution from the Management area of ConceptDraw Solution Park.
How to Create a Bar Chart
The answer how to create a bar chart can be found in ConceptDraw software. The simple tips guide you through the software to quickly learn how to create a bar chart.HelpDesk
How to Create a Bar Chart in ConceptDraw PRO
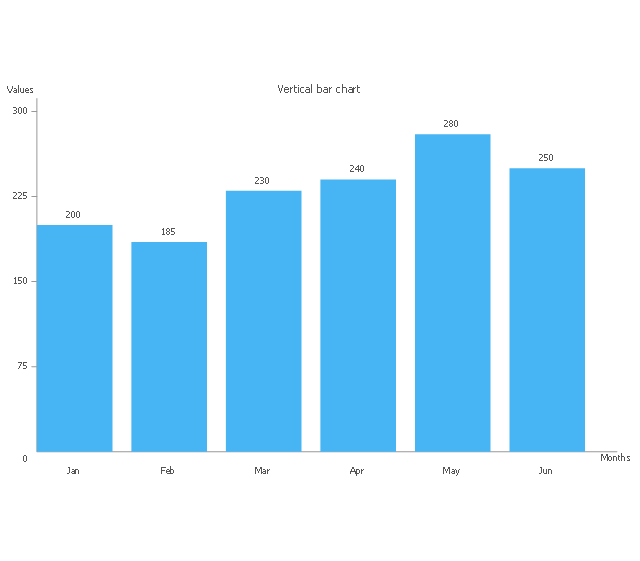
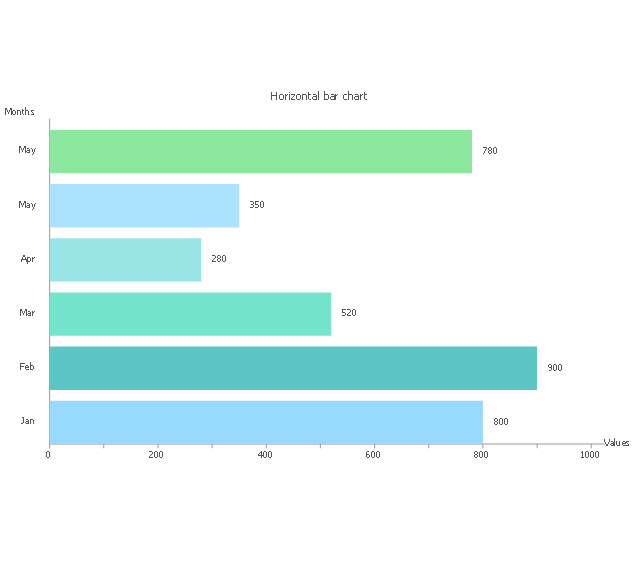
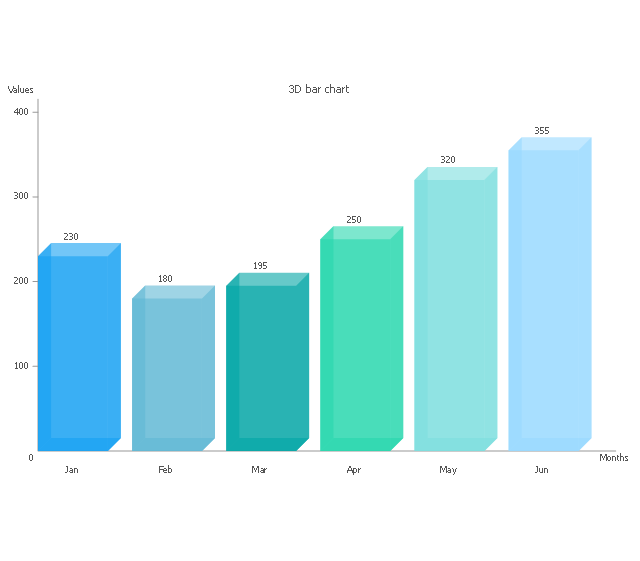
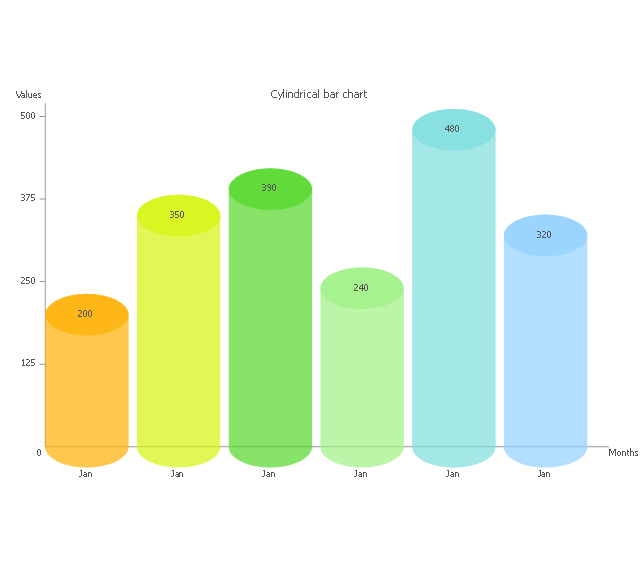
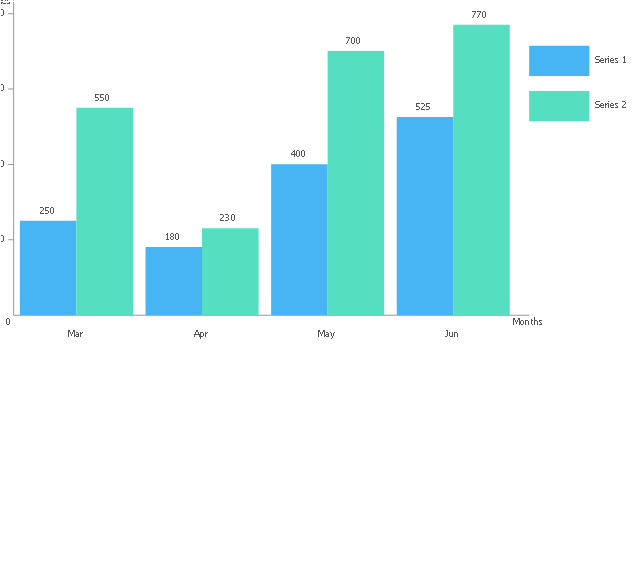
Bar charts (bar graphs) are diagrams displaying data as horizontal or vertical bars of certain heights.Bar charts are widely used to show and compare the values of the same parameters for different data groups.
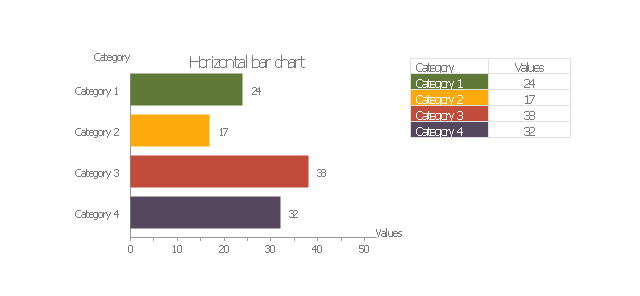
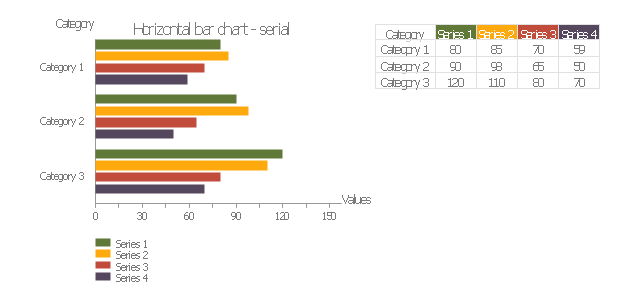
The bar graph can be vertical or horizontal. This depends on the amount of categories. There are many methods in which bar graph can be built and this makes it a very often used chart type. Usually, a bar chart is created so that the bars are placed vertically. Such arrangement means that the bar's height value is proportional to the category value. Nevertheless, a bar chart can be also drawn horizontally. This means that the longer the bar, the bigger the category. Thus, a bar chart is a good way to present the relative values of different measured items. The ConceptDraw Bar Graphs solution allows you to draw a bar chart quickly using a vector library, containing the set of various bar charts objects.
Bar Chart Examples
Complete set of bar chart examples is produced using ConceptDraw software. Surfing bar chart examples you can find an example that is the best for your case.Bar Chart Software
The best bar chart software ever is ConceptDraw. ConceptDraw bar chart software provides an interactive bar charting tool and complete set of predesigned bar chart objects.How to Create a Column Chart
The question how to create a column chart have a simple answer. Use ConceptDraw tips to find out how to create a column chart depicts your data the best way.Chart Maker for Presentations
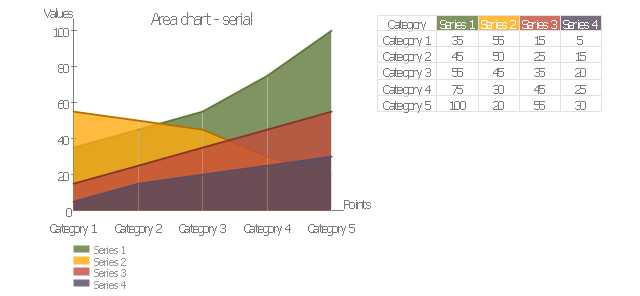
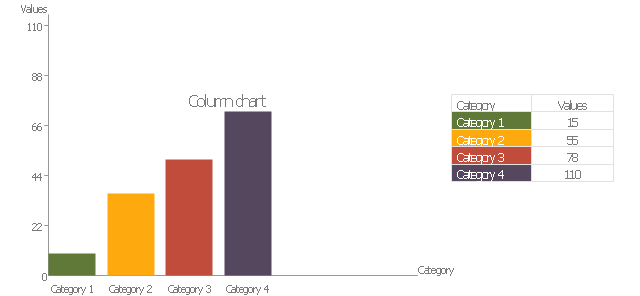
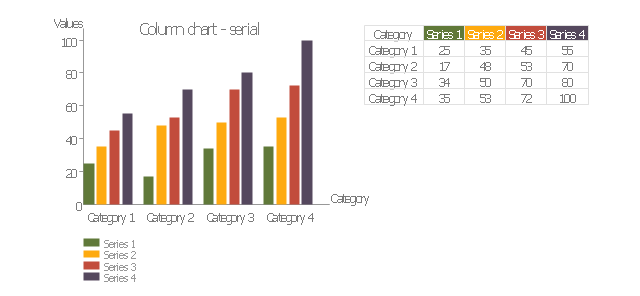
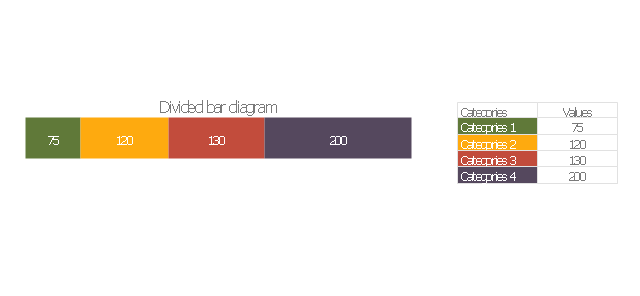
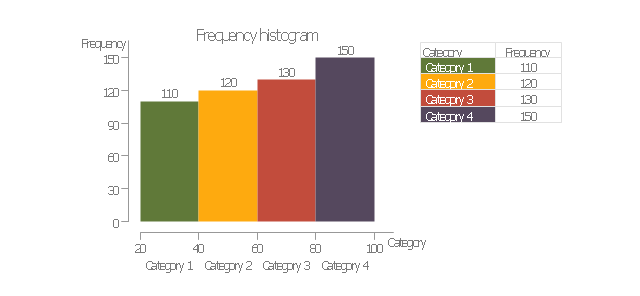
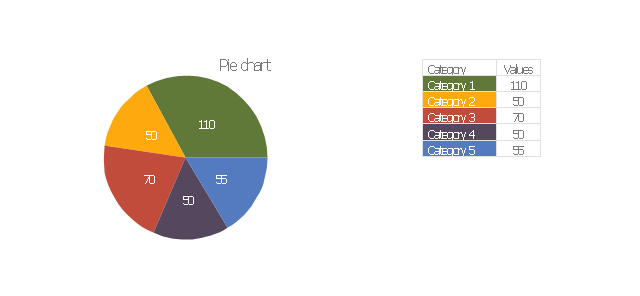
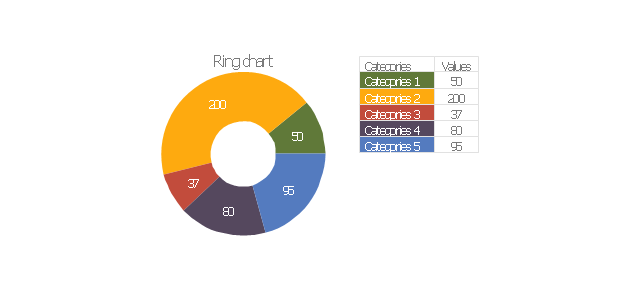
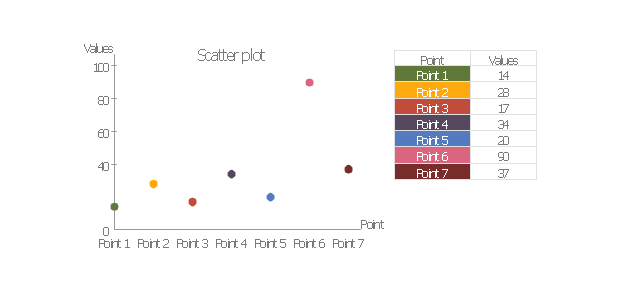
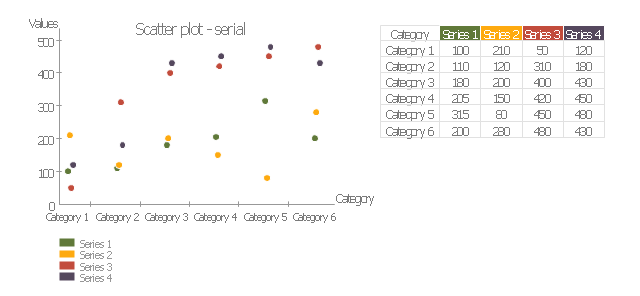
Easy charting software comes with beautiful chart templates and examples. This makes it easy to create professional charts without prior experience.The vector stencils library "Education charts" contains 12 graphs and charts: area chart, column chart, divided bar diagram, histogram, horizontal bar graph, line graph, pie chart, ring chart, scatter plot.
Use it to create your education infogram in the ConceptDraw PRO diagramming and vector drawing software.
The vector stencils library "Education charts" is included in the Education Infographics solution from the Business Infographics area of ConceptDraw Solution Park.
Use it to create your education infogram in the ConceptDraw PRO diagramming and vector drawing software.
The vector stencils library "Education charts" is included in the Education Infographics solution from the Business Infographics area of ConceptDraw Solution Park.
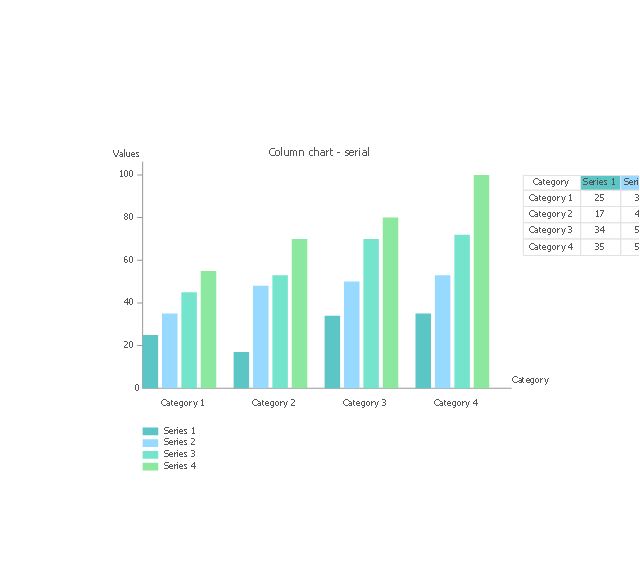
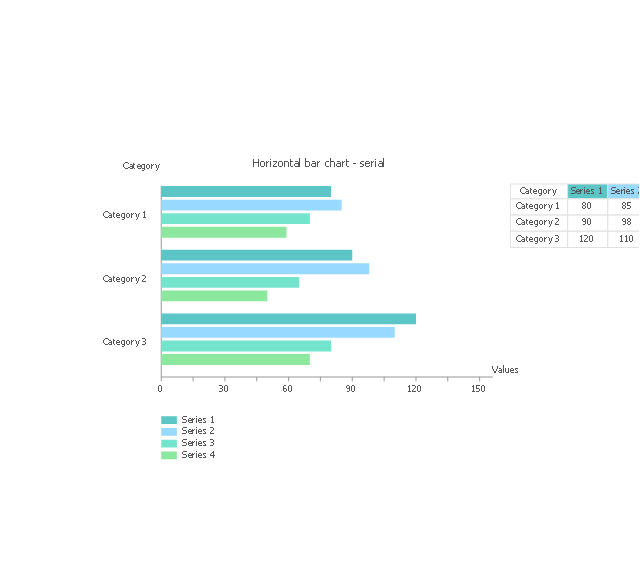
The vector stencils library "Bar charts" contains 7 templates of bar and column charts for visualizing quantitative and statistical data comparison and changes in time series. Drag template from library to your document and enter your data.
Use these shapes to draw your bar graphs in the ConceptDraw PRO diagramming and vector drawing software.
The vector stencils library "Bar charts" is included in the Bar Graphs solution from the Graphs and Charts area of ConceptDraw Solution Park.
Use these shapes to draw your bar graphs in the ConceptDraw PRO diagramming and vector drawing software.
The vector stencils library "Bar charts" is included in the Bar Graphs solution from the Graphs and Charts area of ConceptDraw Solution Park.
How to Create a Line Chart
Create a Line Chart with ConceptDraw using our tips. Here you can find an explanation of how to create a line chart quickly.HelpDesk
How to Draw a Line Chart Quickly
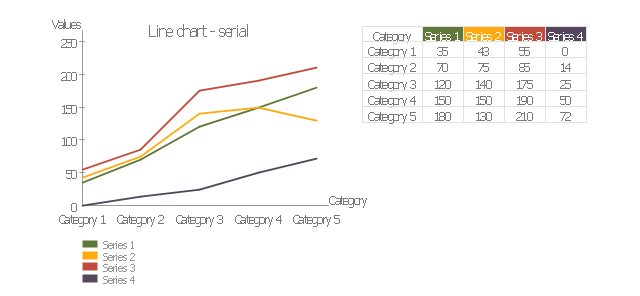
A common line chart is a graphical representation of the functional relationship between two series of data. A line chart that is created by connecting a series of data points together with a straight line is the most basic type of a line chart. A line chart can be used for depicting data that changes continuously over time. It is extensively utilized in statistics, marketing and financial business. ConceptDraw Line Graph solution provides the possibility to make 2D line charts quickly and effortlessly.Column Chart Software
ConceptDraw Column Chart software allows drawing column charts using predesigned objects or drawing tools. In ConceptDraw Column Chart software you can find a complete set of column chart tools and objects.HelpDesk
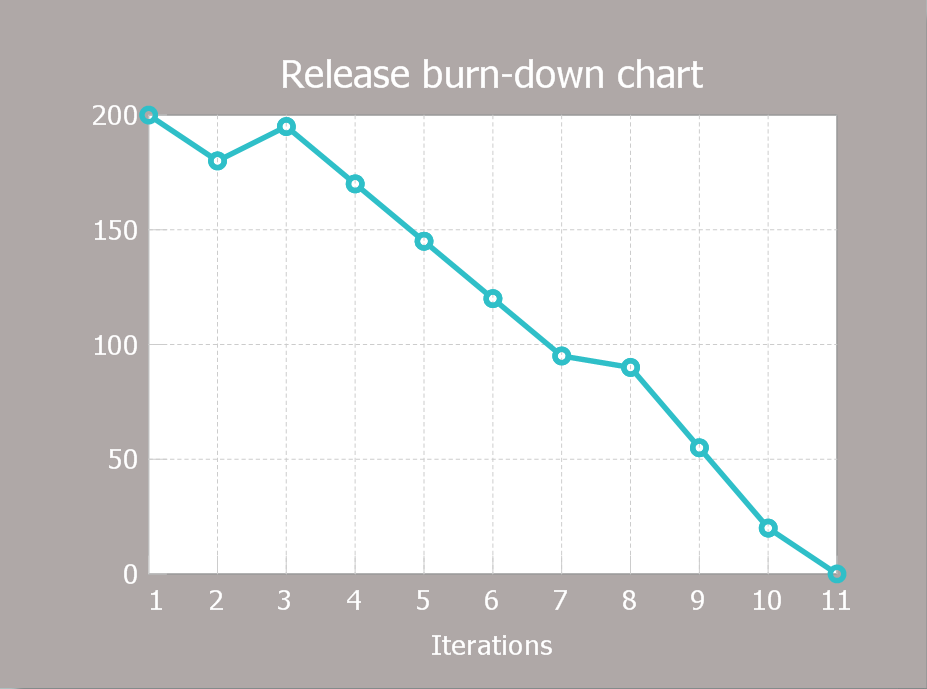
How to Create a Release Burn-Down Chart Using ConceptDraw PRO
The Agile methodology provides project teams the ability to quickly adapt the project to the current situation and thus achieve maximum productivity. According the Scrum method the steps needed to fulfill the project goal breaks down by using short sprints or iterations. The iterations together with an extensive collaboration can increase productivity by better understanding the entire flow of a project. A release burn-down chart is used to track a progress on a Scrum project. The ConceptDraw Scrum Workflow Solution makes it easy for Agile project team to build any professional Scrum diagram such as a Release velocity chart, Release burn-down chart, Sprint burn-down chart, or a Team velocity chart.- Horizontal Org Flow Chart | Horizontal Orgchart | Organizational ...
- Horizontal Flowchart | Horizontal Org Flow Chart | Cross-functional ...
- Bar Chart Examples | Bar Chart Template | Bar Chart | Horizontal ...
- Horizontal Flowchart | Horizontal Org Flow Chart | Process Flowchart ...
- Horizontal Org Flow Chart | Horizontal Orgchart | Create ...
- Horizontal Org Flow Chart | Horizontal Flowchart | Horizontal ...
- Horizontal Orgchart | Horizontal Org Flow Chart | Network Topology ...
- Organizational Chart Templates | Horizontal Org Flow Chart | Pie ...
- Business Board Org Chart | Org Chart Diagram | Horizontal Org Flow ...
- Example of Organizational Chart | Organizational Charts | Horizontal ...
- Process Flowchart | Horizontal Org Flow Chart | Organization Chart ...
- Diagrams Mean Nothing | Gantt Chart Software | Construction ...
- Horizontal Bar Chart Percentage
- Template Horizontal Bar Chart
- Horizontal bar chart - The most spoken languages of the world ...
- The most spoken languages of the world | Bar Chart | Bar Chart ...
- Bar Chart Software | Bar Graphs | Bar Chart Examples | Horizontal ...
- Pyramid Diagram | Pyramid Diagram | Horizontal Org Flow Chart ...
- Horizontal Bar Graph Png
- Horizontal Flowchart | Wireframe Tools | Flow Chart Bootstrap
- ERD | Entity Relationship Diagrams, ERD Software for Mac and Win
- Flowchart | Basic Flowchart Symbols and Meaning
- Flowchart | Flowchart Design - Symbols, Shapes, Stencils and Icons
- Flowchart | Flow Chart Symbols
- Electrical | Electrical Drawing - Wiring and Circuits Schematics
- Flowchart | Common Flowchart Symbols
- Flowchart | Common Flowchart Symbols


