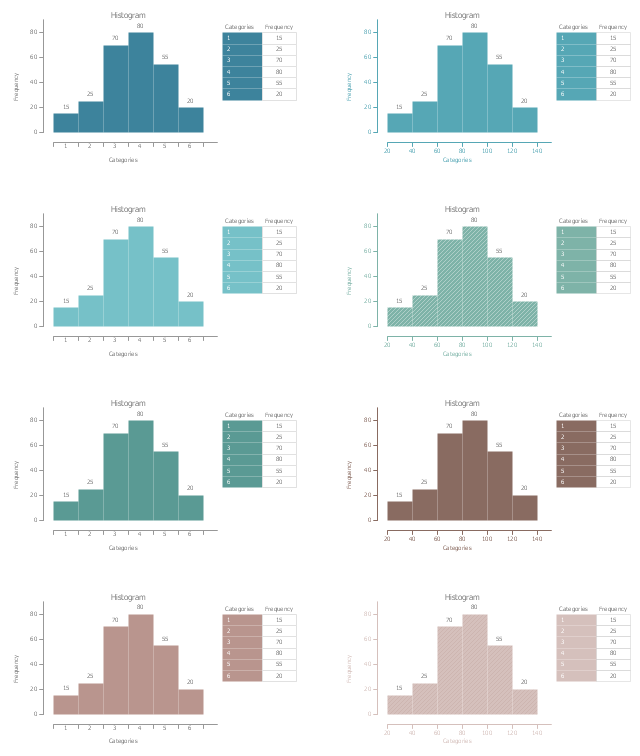
The vector stencils library "Histogram" contains 8 templates of histogram.
Use it to design your histograms with ConceptDraw PRO diagramming and vector drawing software.
"A histogram is a graphical representation of the distribution of numerical data. It is an estimate of the probability distribution of a continuous variable (quantitative variable) and was first introduced by Karl Pearson. ...
The histogram is one of the seven basic tools of quality control." [Histogram. Wikipedia]
The example of diagram templates "Design elements - Histogram" is included in the Seven Basic Tools of Quality solution from the Quality area of ConceptDraw Solution Park.
Histogram templates
Histogram

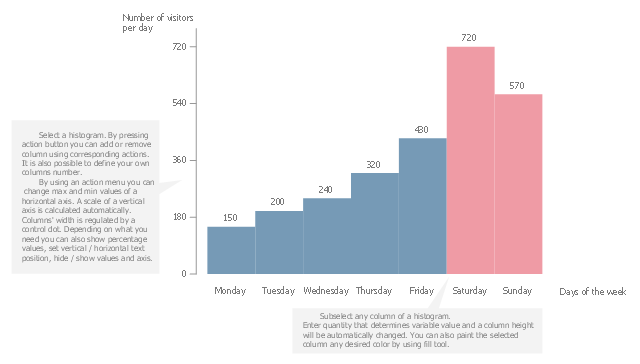
How To Make Histogram in ConceptDraw PRO?

Making a Histogram

Histogram Chart

Make a Histogram

How To Make a Histogram?

How Do You Make a Histogram?

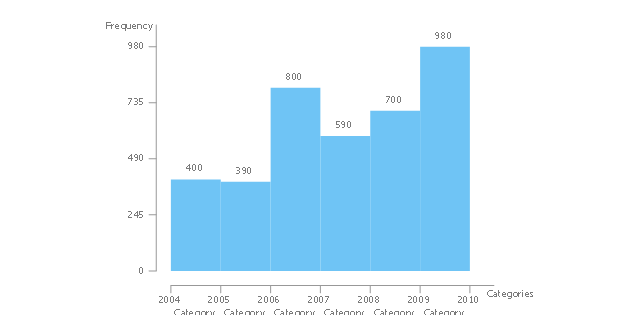
Use this chart template to design your histograms for visualization of probability distribution.
"In probability and statistics, a probability distribution assigns a probability to each measurable subset of the possible outcomes of a random experiment, survey, or procedure of statistical inference. Examples are found in experiments whose sample space is non-numerical, where the distribution would be a categorical distribution; experiments whose sample space is encoded by discrete random variables, where the distribution can be specified by a probability mass function; and experiments with sample spaces encoded by continuous random variables, where the distribution can be specified by a probability density function. More complex experiments, such as those involving stochastic processes defined in continuous time, may demand the use of more general probability measures." [Probability distribution. Wikipedia]
The chart template "Histogram" for the ConceptDraw PRO diagramming and vector drawing software is included in the Basic Histograms solution from the Graphs and Charts area of ConceptDraw Solution Park.
Template
HelpDesk
How to Draw a Histogram in ConceptDraw PRO

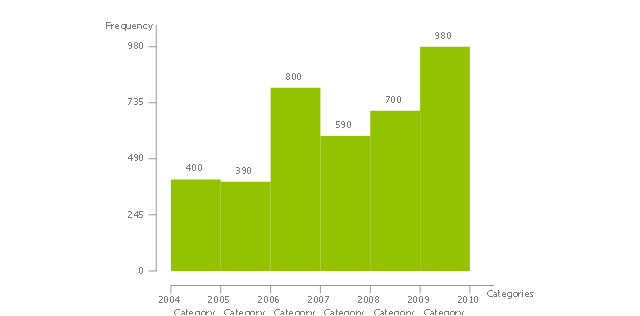
The vector stencils library "Histograms" contains 8 templates of histograms for visualizing frequency distribution data.
Drag a template from the library to your document and enter your data.
Use these shapes to draw your histograms in ConceptDraw PRO diagramming and vector drawing software.
The vector stencils library "Histograms" is included in the Histograms solution from the Graphs and Charts area of ConceptDraw Solution Park.
Frequency histogram
Frequency histogram 2
Frequency histogram 3
Frequency histogram (table)
-histograms---vector-stencils-library.png--diagram-flowchart-example.png)
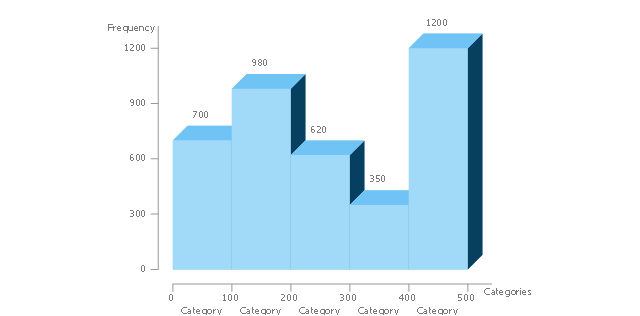
3D frequency histogram
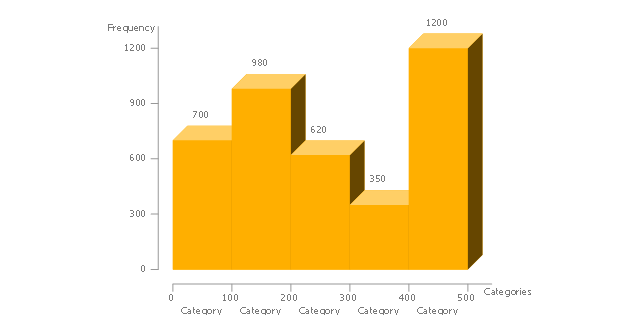
3D frequency histogram 2
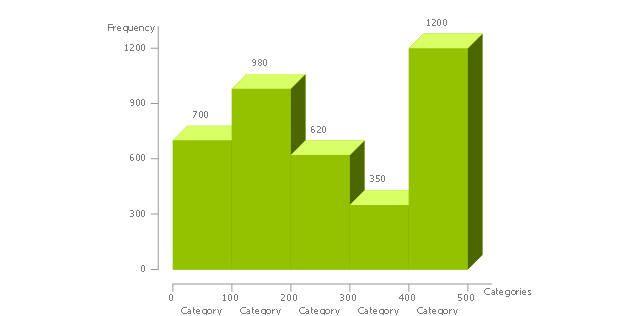
3D frequency histogram 3
3D frequency histogram (table)
-histograms---vector-stencils-library.png--diagram-flowchart-example.png)
 Histograms
How to make a Histogram? Making a Histogram is an incredibly easy process when it is done with ConceptDraw PRO. The Histograms Solution enhances ConceptDraw PRO v10 functionality with extensive drawing tools, numerous samples, and examples; also a quick-start template and library of ready vector stencils for visualization the data and professional drawing Histograms.
Seven Basic Tools of Quality - Histogram

ConceptDraw PRO diagramming and vector drawing software offers a powerful Seven Basic Tools of Quality solution from the Quality area of ConceptDraw Solution Park which contains a set of useful tools for easy drawing Histogram and other quality related diagrams of any complexity.
Pie Chart Examples and Templates

Pie chart examples and templates created using ConceptDraw PRO software helps you get closer with pie charts and find pie chart examples suite your needs.
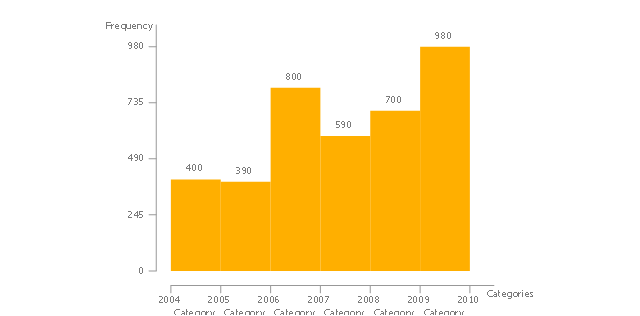
 Basic Histograms
This solution extends the capabilities of ConceptDraw PRO v10.3.0 (or later) with templates, samples and a library of vector stencils for drawing Histograms.
- Frequency Histogram Template
- Design elements - Histograms | Histogram - Template | Histograms ...
- Histogram - Template | Design elements - Histograms | Basic ...
- Basic Diagramming | Pie Chart Examples and Templates | Chart ...
- Basic Diagramming | Donut Chart Templates | Chart Examples ...
- Column Chart Examples | Column Chart Template | How to Draw a ...
- Pie Chart Examples and Templates | How To Make a Histogram ...
- How to Draw a Histogram in ConceptDraw PRO | Histogram ...
- How To Make Histogram in ConceptDraw PRO? | Normal ...
- Histograms - Vector stencils library | Graphs and Charts Area ...
- Histogram Business Example
- Bar Chart Software | Histogram | Create Graphs and Charts ...
- Process Flowchart | Sample for UML | Pie Chart Examples and ...
- Histograms - Vector stencils library | How to Draw a Histogram in ...
- Histograms | How To Make a Histogram ? | How to Draw a Histogram ...
- Picture Graphs | Histograms | ConceptDraw Solution Park | The ...
- Histograms | Histogram Chart | How to Draw a Histogram in ...
- Chart Examples | How to Draw a Histogram in ConceptDraw PRO ...
- How to Draw a Histogram in ConceptDraw PRO | Histograms ...
- Histogram Bar Chart And Pie Chart
- ERD | Entity Relationship Diagrams, ERD Software for Mac and Win
- Flowchart | Basic Flowchart Symbols and Meaning
- Flowchart | Flowchart Design - Symbols, Shapes, Stencils and Icons
- Flowchart | Flow Chart Symbols
- Electrical | Electrical Drawing - Wiring and Circuits Schematics
- Flowchart | Common Flowchart Symbols
- Flowchart | Common Flowchart Symbols