The vector stencils library "Medicine and health pictograms" contains 20 icons of medical and healthcare symbols.
Use it to draw your medical and healthcare infographics.
The example "Medicine and health pictograms - Vector stencils library" was created using the ConceptDraw PRO diagramming and vector drawing software extended with the Pictorial infographics solution from the area "What is infographics" in ConceptDraw Solution Park.
Awareness ribbon

Cardiogram

Stethoscope

Calling an ambulance

Tooth

DNA

First aid

Syringe

Thermometer

Lungs

Medicament

Pills

Patch

Stomach

Hospital

Dropper

Glasses

Case report

Crutches

Pharmacy

"Interrelationship Digraph (ID).
This tool displays all the interrelated cause-and-effect relationships and factors involved in a complex problem and describes desired outcomes. The process of creating an interrelationship digraph helps a group analyze the natural links between different aspects of a complex situation." [Seven Management and Planning Tools. Wikipedia]
"Causality (also referred to as causation) is the relation between an event (the cause) and a second event (the effect), where the second event is understood as a consequence of the first.
In common usage, causality is also the relation between a set of factors (causes) and a phenomenon (the effect). Anything that affects an effect is a factor of that effect. A direct factor is a factor that affects an effect directly, that is, without any intervening factors. (Intervening factors are sometimes called "intermediate factors".) The connection between a cause(s) and an effect in this way can also be referred to as a causal nexus.
Though the causes and effects are typically related to changes or events, candidates include objects, processes, properties, variables, facts, and states of affairs; characterizing the causal relation can be the subject of much debate." [Causality. Wikipedia]
The relations diagram example "Health care" was created using the ConceptDraw PRO diagramming and vector drawing software extended with the solution "Seven Management and Planning Tools" from the Management area of ConceptDraw Solution Park.
Relations diagram

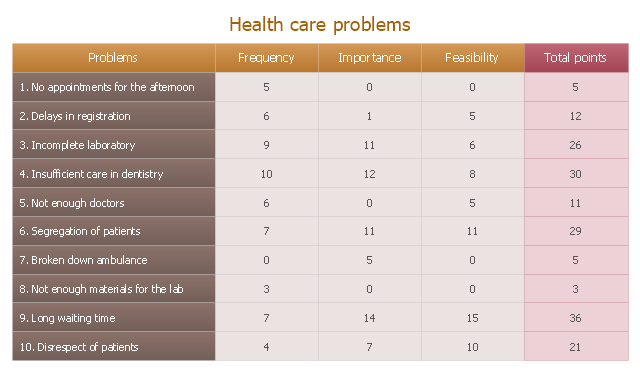
"The management and administration of health care is ... sector vital to the delivery of health care services. In particular, the practice of health professionals and operation of health care institutions is typically regulated by national or state/ provincial authorities through appropriate regulatory bodies for purposes of quality assurance. Most countries have credentialing staff in regulatory boards or health departments who document the certification or licensing of health workers and their work history." [Health care. Wikipedia]
The prioritization matrix example "Health care problems" was created using the ConceptDraw PRO diagramming and vector drawing software extended with the solution Seven Management and Planning Tools from the Management area of ConceptDraw Solution Park.
The prioritization matrix example "Health care problems" was created using the ConceptDraw PRO diagramming and vector drawing software extended with the solution Seven Management and Planning Tools from the Management area of ConceptDraw Solution Park.
Prioritization matrix
This healthcare economics infogram example was redesigned from the Wikimedia Commons file: Medicare spending per capita.png.
"Research by The Dartmouth Institute for Health Policy and Clinical Practice in the Dartmouth Atlas showed that in 2006, Medicare spending varied significantly by state. Other research quoted by the CEA Report indicated that up to 30% of Medicare costs could be saved if the middle- and high-cost states spent at the level of the lower-cost states.[1] Bear in mind that this is a Medicare comparison, so all the persons in the population analyzed are over 65.
References:
1. White House Council of Economic Advisors (CEA)-The Economic Case for Health Care Reform-June 2009-Page 19."
[commons.wikimedia.org/ wiki/ File:Medicare_ spending_ per_ capita.png]
The healthcare management thematic map sample "U.S. Medicare spending per capita" was created using the ConceptDraw PRO diagramming and vector drawing software extended with the Management Infographics solition from the area "Business Infographics" in ConceptDraw Solution Park.
Healthcare management infographics example

 Seven Management and Planning Tools
Seven Management and Planning Tools solution extends ConceptDraw PRO and ConceptDraw MINDMAP with features, templates, samples and libraries of vector stencils for drawing management mind maps and diagrams.
 Enterprise Architecture Diagrams
Enterprise Architecture Diagrams solution extends ConceptDraw PRO software with templates, samples and library of vector stencils for drawing the diagrams of enterprise architecture models.
 Seven Management and Planning Tools
Seven Management and Planning Tools solution extends ConceptDraw PRO and ConceptDraw MINDMAP with features, templates, samples and libraries of vector stencils for drawing management mind maps and diagrams.
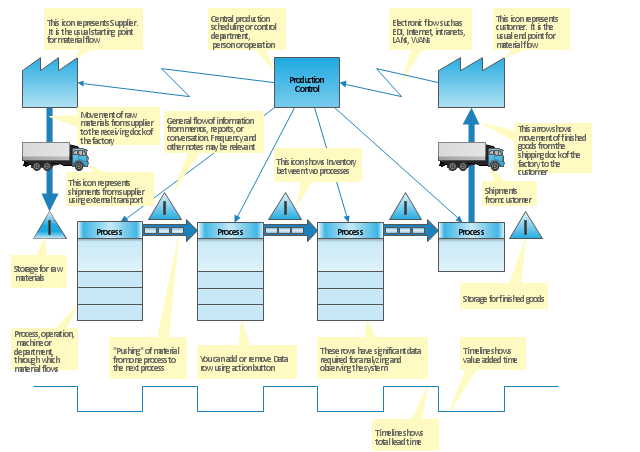
"Value stream mapping is a lean management principle used to analyze and design the flow of materials and information required to bring a product or service to a consumer. Pioneered by Henry Ford in the 1920s, perfected by Toyota. At Toyota, it is known as "material and information flow mapping". It can be applied to nearly any value chain. ...
Value stream mapping has supporting methods that are often used in Lean environments to analyze and design flows at the system level (across multiple processes).
Although value stream mapping is often associated with manufacturing, it is also used in logistics, supply chain, service related industries, healthcare, software development, product development, and administrative and office processes." [Value stream mapping. Wikipedia]
This value stream map template explains the meanings of the VSM design elements.
This Value stream map template for the ConceptDraw PRO diagramming and vector drawing software is included in the Value Stream Mapping solution from the Quality area of ConceptDraw Solution Park.
VSM template
- Medicine and health pictograms - Vector stencils library | Medicine ...
- Relations diagram - Health care | Prioritization matrix - Health care ...
- Prioritization matrix - Health care problems | Seven Management ...
- Design elements - Medicine and health pictograms | Medicine and ...
- Cause And Effect Diagram Examples In Healthcare
- Medicine and health pictograms - Vector stencils library | Design ...
- Medicine and health pictograms - Vector stencils library | App icons ...
- Risk diagram - Chronic Illness Management Program (CIMP ...
- Relations diagram - Health care | PROBLEM ANALYSIS. Relations ...
- Seven Management and Planning Tools | Healthcare Software Clipart
- Medicine and health pictograms - Vector stencils library | How To Do ...
- Medicine and health pictograms - Vector stencils library | Healthy ...
- Quality function deployment chart - Handheld projector | Quality ...
- Health Care Management Program
- Health Food | Social determinants of health | How to Create ...
- Design Pictorial Infographics. Design Infographics | Design ...
- Swot Analysis Healthcare Examples
- Problem Tree Analysis For Healthcare Organizations
- Example Swot Analysis Healthcare Products
- Workflow Diagram In Healthcare
- ERD | Entity Relationship Diagrams, ERD Software for Mac and Win
- Flowchart | Basic Flowchart Symbols and Meaning
- Flowchart | Flowchart Design - Symbols, Shapes, Stencils and Icons
- Flowchart | Flow Chart Symbols
- Electrical | Electrical Drawing - Wiring and Circuits Schematics
- Flowchart | Common Flowchart Symbols
- Flowchart | Common Flowchart Symbols