"The management and administration of health care is ... sector vital to the delivery of health care services. In particular, the practice of health professionals and operation of health care institutions is typically regulated by national or state/ provincial authorities through appropriate regulatory bodies for purposes of quality assurance. Most countries have credentialing staff in regulatory boards or health departments who document the certification or licensing of health workers and their work history." [Health care. Wikipedia]
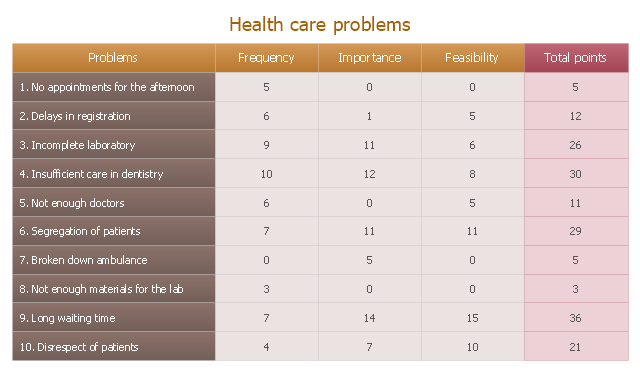
The prioritization matrix example "Health care problems" was created using the ConceptDraw PRO diagramming and vector drawing software extended with the solution Seven Management and Planning Tools from the Management area of ConceptDraw Solution Park.
The prioritization matrix example "Health care problems" was created using the ConceptDraw PRO diagramming and vector drawing software extended with the solution Seven Management and Planning Tools from the Management area of ConceptDraw Solution Park.
Prioritization matrix
"Interrelationship Digraph (ID).
This tool displays all the interrelated cause-and-effect relationships and factors involved in a complex problem and describes desired outcomes. The process of creating an interrelationship digraph helps a group analyze the natural links between different aspects of a complex situation." [Seven Management and Planning Tools. Wikipedia]
"Causality (also referred to as causation) is the relation between an event (the cause) and a second event (the effect), where the second event is understood as a consequence of the first.
In common usage, causality is also the relation between a set of factors (causes) and a phenomenon (the effect). Anything that affects an effect is a factor of that effect. A direct factor is a factor that affects an effect directly, that is, without any intervening factors. (Intervening factors are sometimes called "intermediate factors".) The connection between a cause(s) and an effect in this way can also be referred to as a causal nexus.
Though the causes and effects are typically related to changes or events, candidates include objects, processes, properties, variables, facts, and states of affairs; characterizing the causal relation can be the subject of much debate." [Causality. Wikipedia]
The relations diagram example "Health care" was created using the ConceptDraw PRO diagramming and vector drawing software extended with the solution "Seven Management and Planning Tools" from the Management area of ConceptDraw Solution Park.
Relations diagram

Relationships Analysis

The Seven Management and Planning Tools is a tool for Interaction diagram drawing. This diagram identifies causal relationships. Determine what factors are causes and which factors are effects. Interaction diagram helps establish KPIs to monitor changes and the effectiveness of corrective actions in resolving the problem.

This healthcare economics infogram example was redesigned from the Wikimedia Commons file: Medicare spending per capita.png.
"Research by The Dartmouth Institute for Health Policy and Clinical Practice in the Dartmouth Atlas showed that in 2006, Medicare spending varied significantly by state. Other research quoted by the CEA Report indicated that up to 30% of Medicare costs could be saved if the middle- and high-cost states spent at the level of the lower-cost states.[1] Bear in mind that this is a Medicare comparison, so all the persons in the population analyzed are over 65.
References:
1. White House Council of Economic Advisors (CEA)-The Economic Case for Health Care Reform-June 2009-Page 19."
[commons.wikimedia.org/ wiki/ File:Medicare_ spending_ per_ capita.png]
The healthcare management thematic map sample "U.S. Medicare spending per capita" was created using the ConceptDraw PRO diagramming and vector drawing software extended with the Management Infographics solition from the area "Business Infographics" in ConceptDraw Solution Park.
Healthcare management infographics example

CORRECTIVE ACTIONS PLANNING. Risk Diagram (PDPC)
 - Health care")
Presentations in Educational Process


"Chronic care management encompasses the oversight and education activities conducted by health care professionals to help patients with chronic diseases and health conditions such as diabetes, high blood pressure, lupus, multiple sclerosis and sleep apnea learn to understand their condition and live successfully with it. This term is equivalent to disease management (health) for chronic conditions. The work involves motivating patients to persist in necessary therapies and interventions and helping them to achieve an ongoing, reasonable quality of life." [Chronic care management. Wikipedia]
The health care risk diagram (process decision program chart, PDPC) example "Chronic care improvement" was created using the ConceptDraw PRO diagramming and vector drawing software extended with the solution "Seven Management and Planning Tools" from the Management area of ConceptDraw Solution Park.
The health care risk diagram (process decision program chart, PDPC) example "Chronic care improvement" was created using the ConceptDraw PRO diagramming and vector drawing software extended with the solution "Seven Management and Planning Tools" from the Management area of ConceptDraw Solution Park.
Risk diagram
.png--diagram-flowchart-example.png)
The vector stencils library "Medicine and health pictograms" contains 20 icons of medical and healthcare symbols.
Use it to draw your medical and healthcare infographics.
The example "Medicine and health pictograms - Vector stencils library" was created using the ConceptDraw PRO diagramming and vector drawing software extended with the Pictorial infographics solution from the area "What is infographics" in ConceptDraw Solution Park.
Awareness ribbon

Cardiogram

Stethoscope

Calling an ambulance

Tooth

DNA

First aid

Syringe

Thermometer

Lungs

Medicament

Pills

Patch

Stomach

Hospital

Dropper

Glasses

Case report

Crutches

Pharmacy

 Seven Management and Planning Tools
Seven Management and Planning Tools solution extends ConceptDraw PRO and ConceptDraw MINDMAP with features, templates, samples and libraries of vector stencils for drawing management mind maps and diagrams.
 Building Plans
Easily create the architectural and building engineering drawings: floor plans, restaurant plans, plans of building services, fire and emergency plans, furniture and equipment layouts.
 Seven Management and Planning Tools
Seven Management and Planning Tools solution extends ConceptDraw PRO and ConceptDraw MINDMAP with features, templates, samples and libraries of vector stencils for drawing management mind maps and diagrams.
Geo Map — USA — Montana

The vector stencils library Montana contains contours for ConceptDraw PRO diagramming and vector drawing software. This library is contained in the Continent Maps solution from Maps area of ConceptDraw Solution Park.
This example was created on the base of the figure from the website of Minnesota Department of Health. [health.state.mn.us/ divs/ opi/ qi/ images/ fishbone_ ex.png]
"Minnesota’s Health Alert Network (HAN) enables public health staff, tribal governments, health care providers, emergency workers, and others working to protect the public to exchange information during a disease outbreak, environmental threat, natural disaster, or act of terrorism." [health.state.mn.us/ han/ ]
The fishbone diagram example "HAN project" was created using the ConceptDraw PRO diagramming and vector drawing software extended with the Fishbone Diagrams solution from the Management area of ConceptDraw Solution Park.
Ishikawa diagram

Types of Flowcharts


- Prioritization matrix - Health care problems | Seven Management ...
- Fishbone diagram - HAN project | Relations diagram - Health care ...
- Internet Of Things Healthcare
- Prioritization matrix - Health care problems | Relations diagram ...
- Probability Quality Control Tools | Prioritization matrix - Health care ...
- Healthcare Vector
- Involvement matrix - SEPP program roles and responsibilities ...
- Er Diagram For Healthcare Management System
- Healthcare Management System Er Diagram
- Process Flowchart | Fishbone Diagram For Healthcare Sector
- Seven Management and Planning Tools | Healthcare Software Clipart
- Healthcare Risk Management Corrective Action Tools
- Relations diagram - Health care | Functional Block Diagram | Cross ...
- Swot Analysis In Healthcare Ppt
- How to Import Mind Maps from XMind | Healthcare Wallpaper
- Pharmacy Healthcare Professional Drawing
- Prioritization Matrix | Opportunity prioritization matrix | Prioritization ...
- Healthcare Workflow Diagram
- Healthcare Flowchart Examples
- Example Swot Analysis Healthcare Products
- ERD | Entity Relationship Diagrams, ERD Software for Mac and Win
- Flowchart | Basic Flowchart Symbols and Meaning
- Flowchart | Flowchart Design - Symbols, Shapes, Stencils and Icons
- Flowchart | Flow Chart Symbols
- Electrical | Electrical Drawing - Wiring and Circuits Schematics
- Flowchart | Common Flowchart Symbols
- Flowchart | Common Flowchart Symbols