Sales Growth. Bar Graphs Example

Bar Diagrams for Problem Solving. Create event management bar charts with Bar Graphs Solution

Growth-Share Matrix Software

The Matrices Solution also provides a wide variety of templates and samples that will help you to create the Matrix diagrams of any difficulty.
Waterfall Bar Chart

Competitor Analysis

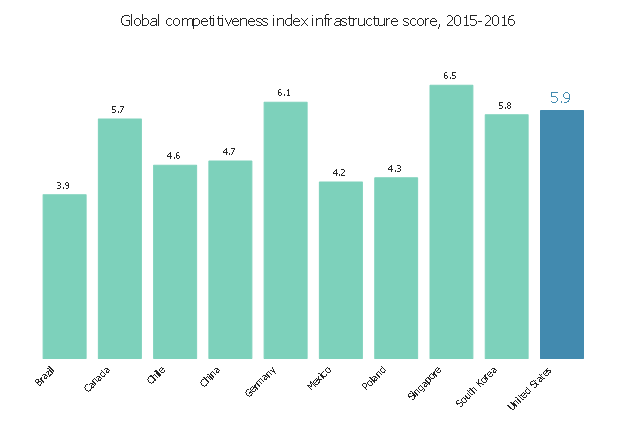
This vertical bar chart sample shows the global competitiveness index infrastructure score in 2015-2016. It was designed using data from the website "Assess Costs Everywhere (ACE)" of the United States Department of Commerce. [acetool.commerce.gov/ shipping]
"The Global Competitiveness Report (GCR) is a yearly report published by the World Economic Forum. Since 2004, the Global Competitiveness Report ranks countries based on the Global Competitiveness Index, developed by Xavier Sala-i-Martin and Elsa V. Artadi. Before that, the macroeconomic ranks were based on Jeffrey Sachs's Growth Development Index and the microeconomic ranks were based on Michael Porter's Business Competitiveness Index. The Global Competitiveness Index integrates the macroeconomic and the micro/ business aspects of competitiveness into a single index." [Global Competitiveness Report. Wikipedia]
The column graph example "Global competitiveness index infrastructure score chart" was created using the ConceptDraw PRO diagramming and vector drawing software extended with the Bar Graphs solution from the Graphs and Charts area of ConceptDraw Solution Park.
Vertical bar graph
Bar Chart Examples

 Basic Area Charts
This solution extends the capabilities of ConceptDraw DIAGRAM (or later) with templates, samples and a library of vector stencils for drawing Area Charts (area graphs) that visualize changes in values by filling in the area beneath the line connecting data points.
HelpDesk
How to Make an Ansoff Matrix Template

Bar Diagrams for Problem Solving. Create business management bar charts with Bar Graphs Solution

BCG Matrix

The vector stencils library "Sales department" contains 49 company department icons.
Use these sales pictograms to draw your sales flowcharts, workflow diagrams and process charts with the ConceptDraw PRO diagramming and vector drawing software.
The vector stencils library "Sales department" is included in the Sales Flowcharts solution from the Marketing area of ConceptDraw Solution Park.
Accounting

Accounts payable

Accounts receivable

Audit

Bank

Board of directors

Copy center

Customer service operator

Customer service technician

Data center

Delivery

Design

Devices management

Distribution

Distribution

Employee

Engineering

Facilities

Finance

Human resource

Devices management

Information systems

International division

International marketing

International sales

Inventory

Legal department

Mail room

Mail service

Management

Manufacturing

Marketing

Motorpool

Online service

Packaging

Payroll

Publications

Purchasing

Quality assurance

Receiving

Reception

Research and development

Sales growth

Scales

Security

Shipping

Suppliers

Telecommunication

Warehouse

How to Make SWOT Analysis in a Word Document

ConceptDraw products across any platform, meaning you never have to worry about compatibility again. ConceptDraw MINDMAP allows you to make SWOT analysis on PC or macOS operating systems.
Fundraising Pyramid

Scrum process work items and workflow

- Growth And Development Charts
- Flow Chart About Human Growth And Development
- Pyramid Chart Examples | Principles Of Growth And Development ...
- Venn Diagram Of Growth And Development
- Venn Diagram Comparison Of Growth And Development
- Path to sustainable development | Pyramid Chart Examples | BCG ...
- Marketing Development Chart
- Growth Chart Png Vector
- Sales Growth . Bar Graphs Example | Business Report Pie. Pie Chart ...
- Bar Graphs | Sales Growth . Bar Graphs Example | Financial ...
- Sales Growth . Bar Graphs Example | Bar Diagrams for Problem ...
- Bar Graph On Growth On Human Resource
- Sales Growth . Bar Graphs Example | Bar Chart Template for Word ...
- Sales Growth . Bar Graphs Example | Marketing and Sales ...
- Human Resource Development | Basic Flowchart Symbols and ...
- Bar Graphs On Sustainable Development
- Research And Development Department
- Sales Growth . Bar Graphs Example | Financial Comparison Chart ...
- Business Growth Chart Graph
- Sales Growth . Bar Graphs Example | Strategy Map | Sales ...
- ERD | Entity Relationship Diagrams, ERD Software for Mac and Win
- Flowchart | Basic Flowchart Symbols and Meaning
- Flowchart | Flowchart Design - Symbols, Shapes, Stencils and Icons
- Flowchart | Flow Chart Symbols
- Electrical | Electrical Drawing - Wiring and Circuits Schematics
- Flowchart | Common Flowchart Symbols
- Flowchart | Common Flowchart Symbols