Process Flowchart


 Marketing Diagrams
Marketing Diagrams solution extends ConceptDraw PRO diagramming software with abundance of samples, templates and vector design elements intended for easy graphical visualization and drawing different types of Marketing diagrams and graphs, including Branding Strategies Diagram, Five Forces Model Diagram, Decision Tree Diagram, Puzzle Diagram, Step Diagram, Process Chart, Strategy Map, Funnel Diagram, Value Chain Diagram, Ladder of Customer Loyalty Diagram, Leaky Bucket Diagram, Promotional Mix Diagram, Service-Goods Continuum Diagram, Six Markets Model Diagram, Sources of Customer Satisfaction Diagram, etc. Analyze effectively the marketing activity of your company and apply the optimal marketing methods with ConceptDraw PRO software.
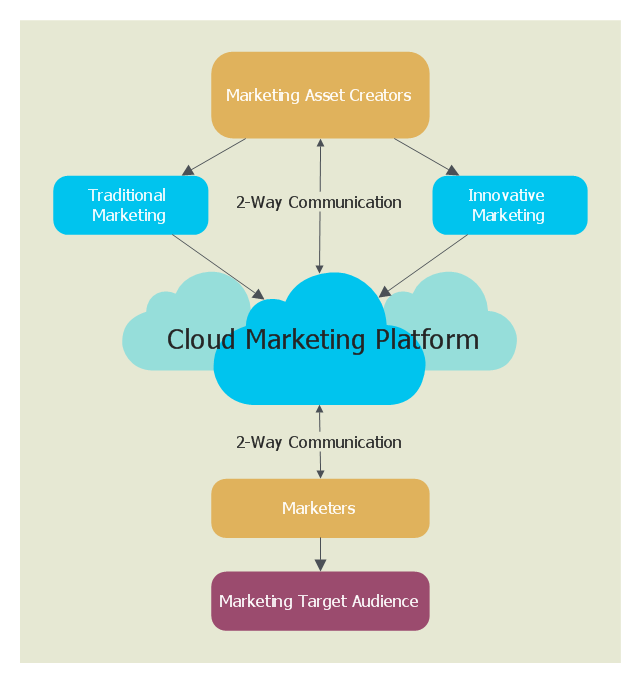
This cloud computing diagram example was drawn on the base of Wikimedia Commons file: CloudMarketingDiagram.png. [commons.wikimedia.org/ wiki/ File:CloudMarketingDiagram.png]
This file is licensed under the Creative Commons Attribution 3.0 Unported license. [creativecommons.org/ licenses/ by/ 3.0/ deed.en]
"Cloud marketing is the process of an organisations efforts to market their goods and services online through integrated digital experiences, by which they are specialised for every single end user. The aim is to use advertising methods to target customers via online applications through social media websites such as Facebook, Twitter and various online portals to target consumers. Cloud marketing platforms are supported with third parties which maintain the platform." [Cloud marketing. Wikipedia]
The example "Cloud marketing diagram" was drawn using ConceptDraw PRO software extended with the Cloud Computing Diagrams solution from the Computer and Networks area of ConceptDraw Solution Park.
Cloud computing diagram example
Flowchart Marketing Process. Flowchart Examples

Using the ready-to-use predesigned objects, samples and templates from the Flowcharts Solution for ConceptDraw PRO you can create your own professional looking Flowchart Diagrams quick and easy.
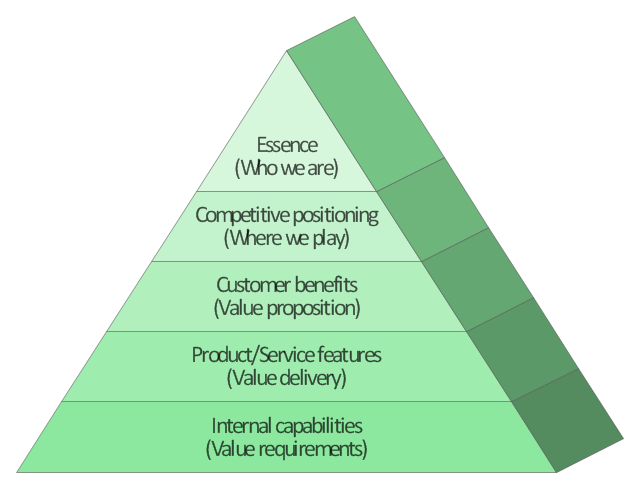
This market value pyramid diagram has 5 levels:
1) Essence (Who we are),
2) Competitive positioning (Where we play),
3) Customer benefits (Value proposition),
4) Product / Service features (Value delivery),
5) Internal capabilitiea (Value requirements).
Use this triangular scheme to develop your marketing strategy.
"Market value or OMV (Open Market Valuation) is the price at which an asset would trade in a competitive auction setting. Market value is often used interchangeably with open market value, fair value or fair market value, although these terms have distinct definitions in different standards, and may differ in some circumstances." [Market value. Wikipedia]
The triangle chart example "Market value" was created using the ConceptDraw PRO diagramming and vector drawing software extended with the Pyramid Diagrams solution from the Marketing area of ConceptDraw Solution Park.
Pyramid diagram
The vector stencils library "Target diagrams" contains 13 templates of target diagrams: marketing mix diagram, principles of marketing diagram, circle diagram, macro-micro environment diagram, stakeholder diagram, target market scope diagram.
Use these shapes to illustrate your marketing and sales documents, presentations, webpages and infographics in the ConceptDraw PRO diagramming and vector drawing software extended with the Target and Circular Diagrams solution from the Marketing area of ConceptDraw Solution Park.
www.conceptdraw.com/ solution-park/ marketing-target-and-circular-diagrams
Principles of marketing by Ph. Kotler

Marketing mix

Target

Principles of marketing by Ph. Kotler (prompt)
-target-diagrams---vector-stencils-library.png--diagram-flowchart-example.png)
Circle diagram

Macro-micro environmental forces diagram

Macro-micro environmental forces diagram (prompt)
-target-diagrams---vector-stencils-library.png--diagram-flowchart-example.png)
Stakeholder diagram

Target market scope diagram

Target diagram 1

Target diagram 2

Target diagram 3

Target diagram

Diagram of a Pyramid

HelpDesk
How to Draw a Pyramid Diagram in ConceptDraw PRO

Flow chart Example. Warehouse Flowchart

Standard warehousing process flow diagram and standard workflow diagram used for process identification for further evaluating effectiveness and profitability of overall business process. Use the ConceptDraw PRO diagramming and vector drawing software extended with the Flowcharts solution from the Diagrams area of ConceptDraw Solution Park to design your own workflow diagrams, process flow diagram and flow charts. Need to use Process Flow Diagram for designing Warehouse packages flow.

 Cloud Computing Diagrams
The Cloud Computing Diagrams solution extends the functionality of the ConceptDraw PRO diagramming software with a comprehensive collection of libraries of commonly accepted cloud computing vector stencils to help you to get started designing Cloud Computing Diagrams, Architecture Diagrams and Cloud Computing Architecture Diagrams without effort. This solution lets one professionally depict the way how the cloud computing works, allows giving a powerful introduction to the Cloud computing architecture and Amazon cloud computing architecture, to display the essence of the cloud computing, the main characteristics and classification of the cloud services thanks to the wide variety of predesigned samples and examples.
How to Build Cloud Computing Diagram Principal Cloud Manufacturing

For documenting the Cloud Computing Architecture with a goal to facilitate the communication between stakeholders are successfully used the Cloud Computing Architecture diagrams. It is convenient and easy to draw various Cloud Computing Architecture diagrams in ConceptDraw PRO software with help of tools of the Cloud Computing Diagrams Solution from the Computer and Networks Area of ConceptDraw Solution Park.
Pyramid Charts

A Pyramid Chart has the form of triangle and hierarchically structures, organizes and help to analyze the information, data or ideas. Triangle is divided on the sections that usually have different widths. The width indicates the level of hierarchy among the topics.
Pyramid Chart Examples

Competitor Analysis

- Green Marketing Management Diagram
- Diagram Of Green Marketing
- Picture For Graph In Green Marketing
- Model Diagram O Green Marketing Mix
- Describe The Green Marketing Pie
- Different Diagram Of Green Marketing
- Green Marketing Strategy
- Green Marketing Chart And Graph
- Green Marketing Based Pics
- Green Development Diagram
- Graph For Green Marketing
- Graphs About Green Marketing
- Marketing Bar And Chart Diagram About 2016 Status
- Marketing Management Process With Diagram
- Marketing Charts | Market Chart | Marketing Analysis Diagram ...
- Bar Graphs | ConceptDraw Solution Park | Line Graphs | Marketing ...
- Gantt Chart Diagram | PM Easy | Flow Chart Online | Scope Of ...
- Meaning Of Marketing Mgt Diagram
- Flowchart Example: Flow Chart of Marketing Analysis | Marketing ...
- Circular Diagram | Process Flowchart | Basic Flowchart Symbols and ...
- ERD | Entity Relationship Diagrams, ERD Software for Mac and Win
- Flowchart | Basic Flowchart Symbols and Meaning
- Flowchart | Flowchart Design - Symbols, Shapes, Stencils and Icons
- Flowchart | Flow Chart Symbols
- Electrical | Electrical Drawing - Wiring and Circuits Schematics
- Flowchart | Common Flowchart Symbols
- Flowchart | Common Flowchart Symbols