Sales Process Flowchart Symbols

 Marketing Diagrams
Marketing Diagrams solution extends ConceptDraw PRO diagramming software with abundance of samples, templates and vector design elements intended for easy graphical visualization and drawing different types of Marketing diagrams and graphs, including Branding Strategies Diagram, Five Forces Model Diagram, Decision Tree Diagram, Puzzle Diagram, Step Diagram, Process Chart, Strategy Map, Funnel Diagram, Value Chain Diagram, Ladder of Customer Loyalty Diagram, Leaky Bucket Diagram, Promotional Mix Diagram, Service-Goods Continuum Diagram, Six Markets Model Diagram, Sources of Customer Satisfaction Diagram, etc. Analyze effectively the marketing activity of your company and apply the optimal marketing methods with ConceptDraw PRO software.
Process Flowchart


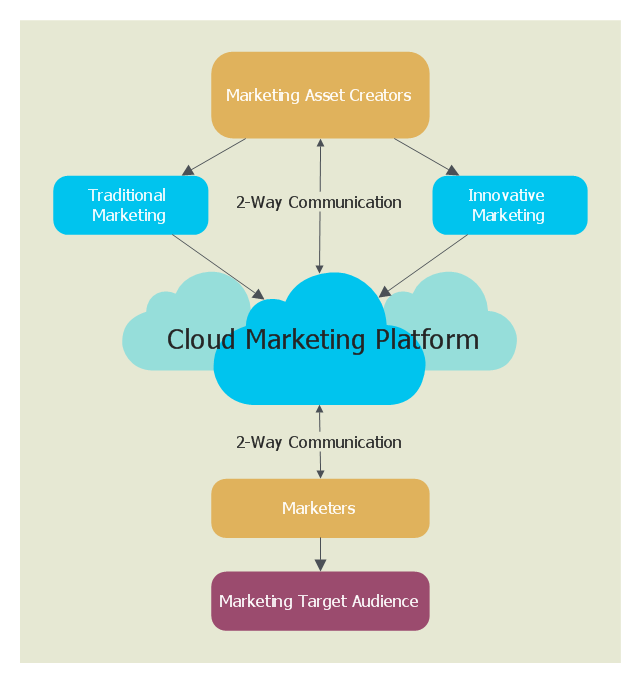
This cloud computing diagram example was drawn on the base of Wikimedia Commons file: CloudMarketingDiagram.png. [commons.wikimedia.org/ wiki/ File:CloudMarketingDiagram.png]
This file is licensed under the Creative Commons Attribution 3.0 Unported license. [creativecommons.org/ licenses/ by/ 3.0/ deed.en]
"Cloud marketing is the process of an organisations efforts to market their goods and services online through integrated digital experiences, by which they are specialised for every single end user. The aim is to use advertising methods to target customers via online applications through social media websites such as Facebook, Twitter and various online portals to target consumers. Cloud marketing platforms are supported with third parties which maintain the platform." [Cloud marketing. Wikipedia]
The example "Cloud marketing diagram" was drawn using ConceptDraw PRO software extended with the Cloud Computing Diagrams solution from the Computer and Networks area of ConceptDraw Solution Park.
Cloud computing diagram example
 Pyramid Diagrams
Pyramid Diagrams solution extends ConceptDraw PRO software with templates, samples and library of vector stencils for drawing the marketing pyramid diagrams.
 Target and Circular Diagrams
This solution extends ConceptDraw PRO software with samples, templates and library of design elements for drawing the Target and Circular Diagrams.
Pyramid Diagram

Target Diagram

Pyramid Diagram

Marketing Charts

Basic Flowchart Examples

Pyramid Diagram

Pyramid Diagram

Pyramid Diagram

- Diagram Of Green Marketing
- Green Marketing Diagram
- Process Flowchart | Marketing Diagrams | Cloud marketing diagram ...
- Green Marketing Management Diagram
- Green Marketing With Diagram
- Model Diagram O Green Marketing Mix
- Explain The Green Marketing Pie Chart
- Different Diagram Of Green Marketing
- Green Marketing Chart And Graph
- Picture For Graph In Green Marketing
- Green Marketing Chart
- Green Marketing Strategy
- Green Marketing Chart In A Graphical Manner
- Green Marketing Charts
- Pie Chart Of Green Market Recent In 2016
- Green Marketing Flowchart Template
- Describe The Green Marketing Pie
- Perfect Diagrams For Green Marketing
- Graph Representation Of Green Marketing Growth
- Green Marketing Based Pics
- ERD | Entity Relationship Diagrams, ERD Software for Mac and Win
- Flowchart | Basic Flowchart Symbols and Meaning
- Flowchart | Flowchart Design - Symbols, Shapes, Stencils and Icons
- Flowchart | Flow Chart Symbols
- Electrical | Electrical Drawing - Wiring and Circuits Schematics
- Flowchart | Common Flowchart Symbols
- Flowchart | Common Flowchart Symbols