Bar Diagrams for Problem Solving. Create economics and financial bar charts with Bar Graphs Solution

The 3D vertical bar graph sample shows the Iran internet users per 100 person from 2000 to 2011. It was designed on the base of the Commons Wikimedia file: Iran internet users per 100 person.png.
[commons.wikimedia.org/ wiki/ File:Iran_ internet_ users_ per_ 100_ person.png]
This file is licensed under the Creative Commons Attribution-Share Alike 3.0 Unported license. [creativecommons.org/ licenses/ by-sa/ 3.0/ deed.en]
The data source is World Bank: [data.worldbank.org/ country/ iran-islamic-republic]
"In 1993 Iran became the second country in the Middle East to be connected to the Internet, and since then the government has made significant efforts to improve the nation's ICT infrastructure. Iran's national Internet connectivity infrastructure is based on two major networks: the public switched telephone network (PSTN) and the public data network. The PSTN provides a connection for end-users to Internet service providers (ISPs) over mostly digital lines and supports modem-based connections. The Data Communication Company of Iran (DCI), a subsidiary of TCI, operates the public data network." [Internet in Iran. Wikipedia]
The 3D column chart example "Iran internet users per 100 person" was created using the ConceptDraw PRO diagramming and vector drawing software extended with the Bar Graphs solution from the Graphs and Charts area of ConceptDraw Solution Park.
3D Column chart

Venn Diagram Examples for Problem Solving. Environmental Social Science. Human Sustainability Confluence

Create your Venn diagrams for problem solving in environmental social science using the ConceptDraw PRO diagramming and vector drawing software extended with the Venn Diagrams solution from the area "Diagrams" of ConceptDraw Solution Park.
Process Flowchart


Lean Manufacturing Diagrams
 design elements")
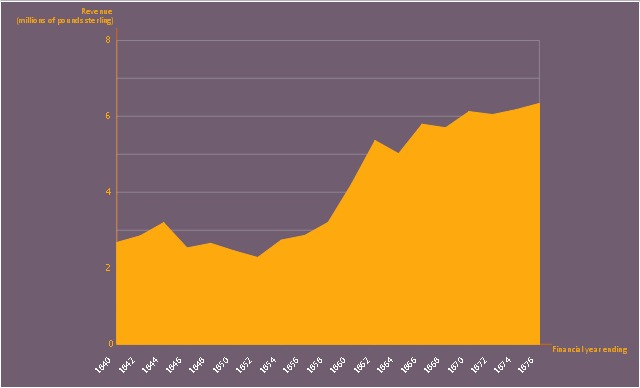
This area chart sample shows the revenue collected by the East India Company (after 1858 the British government) from salt (including inland and port taxes and sale of government salt). It was designed on the base of the Wikimedia Commons file: British India salt revenue 1840-1877.png.
[commons.wikimedia.org/ wiki/ File:British_ India_ salt_ revenue_ 1840-1877.png]
This file is licensed under the Creative Commons Attribution-Share Alike 3.0 Unported license. [creativecommons.org/ licenses/ by-sa/ 3.0/ deed.en]
"The Inland Customs Line which incorporated the Great Hedge of India (or Indian Salt Hedge[1]) was a customs barrier built by the British across India primarily to collect the salt tax. The customs line was begun while India was under the control of the East India Company but continued into the period of direct British rule. The line had its beginnings in a series of customs houses that were established in Bengal in 1803 to prevent the smuggling of salt to avoid the tax. These customs houses were eventually formed into a continuous barrier that was brought under the control of the Inland Customs Department in 1843." [Inland Customs Line. Wikipedia]
The area graph example "British India salt revenue 1840-1877" was created using the ConceptDraw PRO diagramming and vector drawing software extended with the Area Charts solution from the Graphs and Charts area of ConceptDraw Solution Park.
Area chart
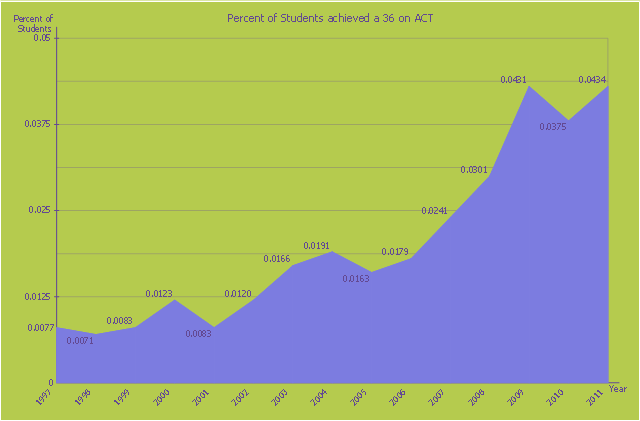
This area chart sample shows the percent of students achieved a 36 on ACT from 1997 to 2011. It was designed on the base of the Wikimedia Commons file: ACT-36-1997 to 2011.png. [commons.wikimedia.org/ wiki/ File:ACT-36-1997_ to_ 2011.png]
This file is licensed under the Creative Commons Attribution-Share Alike 3.0 Unported license. [creativecommons.org/ licenses/ by-sa/ 3.0/ deed.en]
"The ACT (originally an abbreviation of American College Testing) college readiness assessment is a standardized test for high school achievement and college admissions in the United States produced by ACT, Inc. ...
The required portion of the ACT is divided into four multiple choice subject tests: English, mathematics, reading, and science reasoning. Subject test scores range from 1 to 36; all scores are integers. The English, mathematics, and reading tests also have subscores ranging from 1 to 18. (The subject score is not the sum of the subscores.) The composite score is the average of all four tests. In addition, students taking the optional writing test receive a writing score ranging from 1 to 36 (This is a change from the previous 2–12 score range). The writing score does not affect the composite score." [ACT (test). Wikipedia]
The area graph example "Persent of Students achieved a 36 on ACT" was created using the ConceptDraw PRO diagramming and vector drawing software extended with the Area Charts solution from the Graphs and Charts area of ConceptDraw Solution Park.
Area chart
 Pie Charts
Pie Charts are extensively used in statistics and business for explaining data and work results, in mass media for comparison (i.e. to visualize the percentage for the parts of one total), and in many other fields. The Pie Charts solution for ConceptDraw PRO v10 offers powerful drawing tools, varied templates, samples, and a library of vector stencils for simple construction and design of Pie Charts, Donut Chart, and Pie Graph Worksheets.
Bar Chart Examples

Pyramid Diagram

Chart Examples

This picture bar graph sample shows the computer and Internet use at home from 1984 to 2014. It was designed using data from website of the United States Census Bureau (USCB).
[census.gov/ content/ dam/ Census/ library/ visualizations/ 2016/ comm/ digital_ nation.png]
"Home automation is the residential extension of building automation and involves the control and automation of lighting, heating, ventilation, air conditioning (HVAC), appliances, and security. Modern systems generally consist of switches and sensors connected to a central hub sometimes called a "gateway" from which the system is controlled with a user interface that is interacted either with a wall-mounted terminal, mobile phone software, tablet computer or a web interface." [Home automation. Wikipedia]
The pictorial chart example "Computer and Internet use at home over time" was created using the ConceptDraw PRO diagramming and vector drawing software extended with the Picture Graphs solution from the Graphs and Charts area of ConceptDraw Solution Park.
Image chart

 Bar Graphs
The Bar Graphs solution enhances ConceptDraw PRO v10 functionality with templates, numerous professional-looking samples, and a library of vector stencils for drawing different types of Bar Graphs, such as Simple Bar Graph, Double Bar Graph, Divided Bar Graph, Horizontal Bar Graph, Vertical Bar Graph, and Column Bar Chart.
- Bar Graphs | Double Sense Arrows Png
- Holiday | Pie Charts | Line Graphs | New Year And Christmas Card ...
- 3d Circle Png
- Bar Graphs Png
- Pictures of Graphs | Pictures of Vegetables | Pictures of Food | Pict ...
- Charts And Graphs Png
- Percentage Chart Png
- Stomach Vector Png
- Food - Vector stencils library | Picture graphs - Vector stencils library ...
- Growth-Share Matrix Software | Sales Growth. Bar Graphs Example ...
- Line graphs - Vector stencils library | Transmission paths - Vector ...
- How To Create Restaurant Floor Plan in Minutes | Bar Graphs | India ...
- Internet Users Graph And Charts Full
- Financial Symbols Png
- Professions - Vector stencils library | Line graphs - Vector stencils ...
- Create Graphs and Charts | Geo Map - Europe - Bulgaria | Geo Map ...
- Sales Growth. Bar Graphs Example | Currency - Vector stencils ...
- Cargo Ship Png
- Child Vector Png
- Geography - Vector stencils library | Create Graphs and Charts | App ...
- ERD | Entity Relationship Diagrams, ERD Software for Mac and Win
- Flowchart | Basic Flowchart Symbols and Meaning
- Flowchart | Flowchart Design - Symbols, Shapes, Stencils and Icons
- Flowchart | Flow Chart Symbols
- Electrical | Electrical Drawing - Wiring and Circuits Schematics
- Flowchart | Common Flowchart Symbols
- Flowchart | Common Flowchart Symbols