 Pie Charts
Pie Charts are extensively used in statistics and business for explaining data and work results, in mass media for comparison (i.e. to visualize the percentage for the parts of one total), and in many other fields. The Pie Charts solution for ConceptDraw PRO v10 offers powerful drawing tools, varied templates, samples, and a library of vector stencils for simple construction and design of Pie Charts, Donut Chart, and Pie Graph Worksheets.
HelpDesk
How to Draw a Pie Chart Using ConceptDraw PRO

HelpDesk
How to Draw the Different Types of Pie Charts
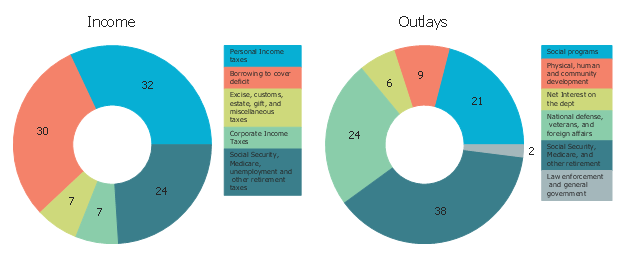
These doughnut charts show the relative sizes of the major categories of the federal income and outlays for fiscal year 2012. It was designed on the base of the pie charts from the website of the Internal Revenue Service (IRS), U.S. Department of the Treasury.
[apps.irs.gov/ app/ understandingTaxes/ whys/ thm01/ les01/ ac3_ thm01_ les01.jsp]
"An income tax is a tax imposed on individuals or entities (taxpayers) that varies with the income or profits (taxable income) of the taxpayer. Details vary widely by jurisdiction. Many jurisdictions refer to income tax on business entities as companies tax or corporate tax. Partnerships generally are not taxed; rather, the partners are taxed on their share of partnership items. Tax may be imposed by both a country and subdivisions. Most jurisdictions exempt locally organized charitable organizations from tax." [Income tax. Wikipedia]
The donut charts example "Income and outlays" was created using the ConceptDraw PRO diagramming and vector drawing software extended with the Pie Charts solution of the Graphs and Charts area in ConceptDraw Solution Park.
Donut chart
 Bar Graphs
The Bar Graphs solution enhances ConceptDraw PRO v10 functionality with templates, numerous professional-looking samples, and a library of vector stencils for drawing different types of Bar Graphs, such as Simple Bar Graph, Double Bar Graph, Divided Bar Graph, Horizontal Bar Graph, Vertical Bar Graph, and Column Bar Chart.
 Graphs and Charts Area
Solutions from the Graphs and Charts Area of ConceptDraw Solution Park collect templates, samples and libraries of vector stencils for visualization of numerical data.
 ConceptDraw Solution Park
ConceptDraw Solution Park collects graphic extensions, examples and learning materials
HelpDesk
How to Create a Picture Graph in ConceptDraw PRO

HelpDesk
How to Create Data-driven Infographics

 Composition Dashboard
Composition dashboard solution extends ConceptDraw PRO software with templates, samples and vector stencils library with charts and indicators for drawing visual dashboards showing data composition.
 Basic Diagramming
This solution extends ConceptDraw PRO software with the specific tools you need to easily draw flowcharts, block diagrams, histograms, pie charts, divided bar diagrams, line graphs, circular arrows diagrams, Venn diagrams, bubble diagrams and concept maps
 Line Graphs
How to draw a Line Graph with ease? The Line Graphs solution extends the capabilities of ConceptDraw PRO v10 with professionally designed templates, samples, and a library of vector stencils for drawing perfect Line Graphs.
HelpDesk
How to Create Education Infographics

HelpDesk
How to Add Data-driven Infographics to a MS Word Document Using ConceptDraw PRO

 Picture Graphs
Typically, a Picture Graph has very broad usage. They many times used successfully in marketing, management, and manufacturing. The Picture Graphs Solution extends the capabilities of ConceptDraw PRO v10 with templates, samples, and a library of professionally developed vector stencils for designing Picture Graphs.
- Business Report Pie. Pie Chart Examples | Bar Chart Examples ...
- Organizational Chart Templates | Sales Growth. Bar Graphs ...
- Pictorial Representation Of Partnership
- How to Draw the Different Types of Pie Charts | France exports of ...
- Business Report Pie. Pie Chart Examples | Line Graph | Pie Chart ...
- Bar Diagram Math | Pie Charts | Top iPad Business Process ...
- Percentage Pie Chart . Pie Chart Examples | Approximate ...
- Pie Chart Software | How to Draw a Pie Chart Using ConceptDraw ...
- Schedule pie chart - Daily action plan | Pie Graph Worksheets | Pie ...
- Disaster Management Pie Chart And Bar Graph For Maths
- Sales Growth. Bar Graphs Example | Bar Chart Examples | Bar ...
- Pie Chart Software | Pie Chart Word Template. Pie Chart Examples ...
- Pie Graph Worksheets | Rainfall Bar Chart | Percentage Pie Chart ...
- How to Draw a Pie Chart Using ConceptDraw PRO | Pie Chart ...
- Pie Charts
- Pie Graph Showing Composition Of Air
- Percentage Pie Chart . Pie Chart Examples | Sales Growth. Bar ...
- Approximate composition of the air - Pie chart | Atmosphere Gases ...
- Chart Examples | Sales Growth. Bar Graphs Example | Chart ...
- Bar Graphs And Pie Charts Natural Resources
- ERD | Entity Relationship Diagrams, ERD Software for Mac and Win
- Flowchart | Basic Flowchart Symbols and Meaning
- Flowchart | Flowchart Design - Symbols, Shapes, Stencils and Icons
- Flowchart | Flow Chart Symbols
- Electrical | Electrical Drawing - Wiring and Circuits Schematics
- Flowchart | Common Flowchart Symbols
- Flowchart | Common Flowchart Symbols