The vector stencils library "Picture bar graphs" contains 35 templates of pictorial charts. Use it for visualization of data comparison and time series with ConceptDraw PRO diagramming and vector drawing software.
"Pictorial bar graph.
Sometimes reffered to as a pictographs. A pictorial bar graph is a graph in which the rectangular bars have been filled with pictures, sketches, icons, etc. or where pictures, sketches, icons, etc. have been substituted for the rectangular bars. In both variations, one or more symbols might be used in each bar. The two major reasons for using pictorial graphs are to make the graph more appealing visually and to facilitate better communications." [Information Graphics: A Comprehensive Illustrated Reference. R. L. Harris. 1999. p.41]
The pictorial charts example "Design elements - Picture bar graphs" is included in the Picture Graphs solution from the Graphs and Charts area of ConceptDraw Solution Park.
Templates

The vector stencils library "Picture Graphs" contains 4 image chart templates. Use it to design your pictorial bar charts in ConceptDraw PRO diagramming and vector drawing software.
"Pictorial bar graph.
Sometimes reffered to as a pictographs. A pictorial bar graph is a graph in which the rectangular bars have been filled with pictures, sketches, icons, etc. or where pictures, sketches, icons, etc. have been substituted for the rectangular bars. In both variations, one or more symbols might be used in each bar. The two major reasons for using pictorial graphs are to make the graph more appealing visually and to facilitate better communications." [Information Graphics: A Comprehensive Illustrated Reference. R. L. Harris. 1999. p.41]
The chart templates example "Design elements - Picture graphs" is included in the Basic Picture Graphs solution from the Graphs and Charts area of ConceptDraw Solution Park.
Pictorial chart templates

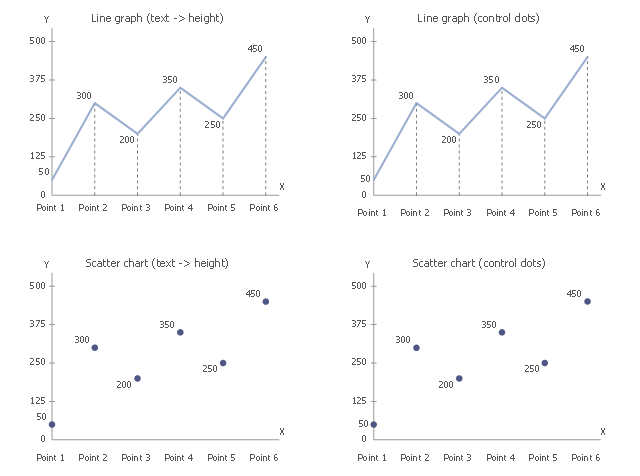
The vector stencils library "Line Graphs" contains 4 chart templates. Use it to design your line charts in ConceptDraw PRO diagramming and vector drawing software.
"A line chart or line graph is a type of chart which displays information as a series of data points connected by straight line segments. It is a basic type of chart common in many fields. It is similar to a scatter plot except that the measurement points are ordered (typically by their x-axis value) and joined with straight line segments. A line chart is often used to visualize a trend in data over intervals of time – a time series – thus the line is often drawn chronologically." [Line chart. Wikipedia]
The templates example "Design elements - Line graphs" is included in the Basic Line Graphs solution from the Graphs and Charts area of ConceptDraw Solution Park.
Chart templates
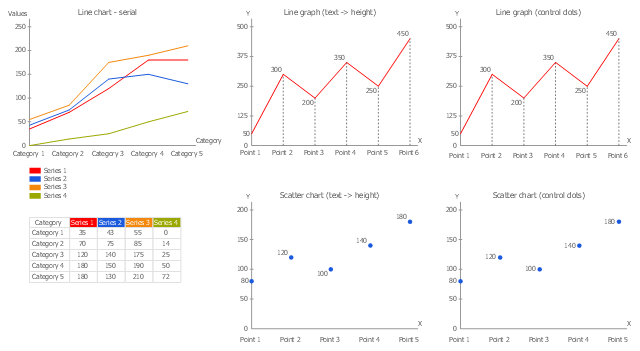
"A line chart or line graph is a type of chart which displays information as a series of data points connected by straight line segments. It is a basic type of chart common in many fields. It is similar to a scatter plot except that the measurement points are ordered (typically by their x-axis value) and joined with straight line segments. A line chart is often used to visualize a trend in data over intervals of time – a time series – thus the line is often drawn chronologically." [Line chart. Wikipedia]
The templates example "Design elements - Line graphs" was drawn using the ConceptDraw PRO diagramming and vector drawing software extended with the Line Graphs solution from the Graphs and Charts area of ConceptDraw Solution Park.
The templates example "Design elements - Line graphs" was drawn using the ConceptDraw PRO diagramming and vector drawing software extended with the Line Graphs solution from the Graphs and Charts area of ConceptDraw Solution Park.
Templates
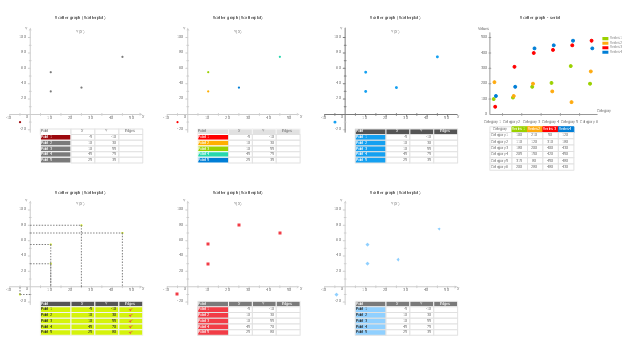
This vector stencils library contains 7 templates of scatter graphs (scattergraphs, scatter charts, scatter plots, scatterplots, scatter diagrams). Use it to design your scatter graphs with ConceptDraw PRO diagramming and vector drawing software for visual analysis of correlation or dependence between two variables.
"In statistics, dependence is any statistical relationship between two random variables or two sets of data. Correlation refers to any of a broad class of statistical relationships involving dependence.
Familiar examples of dependent phenomena include the correlation between the physical statures of parents and their offspring, and the correlation between the demand for a product and its price. Correlations are useful because they can indicate a predictive relationship that can be exploited in practice. For example, an electrical utility may produce less power on a mild day based on the correlation between electricity demand and weather. In this example there is a causal relationship, because extreme weather causes people to use more electricity for heating or cooling; however, statistical dependence is not sufficient to demonstrate the presence of such a causal relationship (i.e., correlation does not imply causation).
Formally, dependence refers to any situation in which random variables do not satisfy a mathematical condition of probabilistic independence. In loose usage, correlation can refer to any departure of two or more random variables from independence, but technically it refers to any of several more specialized types of relationship between mean values." [Correlation and dependence. Wikipedia]
The chart templates example "Design elements - Scatter graphs" is included in the Scatter Diagrams solution from the Graphs and Charts area of ConceptDraw Solution Park.
Templates
Create Graphs and Charts

The vector stencils library "Picture Graphs" contains 35 templates of picture bar graphs for visual data comparison and time series.
Drag a template from the library to your document, set bars number, type category labels, select bars and enter your data.
Use these shapes to draw your pictorial bar charts in the ConceptDraw PRO diagramming and vector drawing software.
The vector stencils library "Picture Graphs" is included in the Picture Graphs solution from the Graphs and Charts area of ConceptDraw Solution Park.
Arrow
Water drop

Food

Grain

Agriculture

Medicines

Houses

Buildings

Money bags

Oil barrels

Natural gas

Electrical power

Nuclear power

Mechanical engineering

Chemical industry

Mining

Gold bars

Coins

Person

Men, women and children

Man

Woman

Child

Milk

Meat

Fruits

Vegetables

Computer

Mobile phone

Airliner

Car

Bus

Truck

Train

Cargo ship

The vector stencils library Bar charts contains templates you can simply drag from the library to your document in the the ConceptDraw PRO diagramming and vector drawing software, and add your data.
"A bar chart or bar graph is a chart with rectangular bars with lengths proportional to the values that they represent. The bars can be plotted vertically or horizontally. A vertical bar chart is sometimes called a column bar chart. ...
A bar graph is a chart that uses either horizontal or vertical bars to show comparisons among categories. One axis of the chart shows the specific categories being compared, and the other axis represents a discrete value. Some bar graphs present bars clustered in groups of more than one (grouped bar graphs), and others show the bars divided into subparts to show cumulate effect (stacked bar graphs)." [Bar chart. Wikipedia]
The graph template set "Design elements - Bar charts" is included the Basic Bar Graphs solution from the Graphs and Charts area of ConceptDraw Solution Park.
Bar graph templates
Picture Graph

 Building Design Package
Architects and building engineers to develop building documentation, floor plans and building blueprints, to help designers depict bright and innovative design solutions, make beautiful design proposals and represent the most daring design ideas, to communicate ideas and concepts that relate to construction and design, explain requirements to a building contractor and builders, record completed work, and make a record of what currently exists.
"A chart can take a large variety of forms, however there are common features that provide the chart with its ability to extract meaning from data.
Typically the data in a chart is represented graphically, since humans are generally able to infer meaning from pictures quicker than from text. Text is generally used only to annotate the data.
One of the more important uses of text in a graph is the title. A graph's title usually appears above the main graphic and provides a succinct description of what the data in the graph refers to.
Dimensions in the data are often displayed on axes. If a horizontal and a vertical axis are used, they are usually referred to as the x-axis and y-axis respectively. Each axis will have a scale, denoted by periodic graduations and usually accompanied by numerical or categorical indications. Each axis will typically also have a label displayed outside or beside it, briefly describing the dimension represented. If the scale is numerical, the label will often be suffixed with the unit of that scale in parentheses. ...
Within the graph a grid of lines may appear to aid in the visual alignment of data. The grid can be enhanced by visually emphasizing the lines at regular or significant graduations. The emphasized lines are then called major grid lines and the remainder are minor grid lines.
The data of a chart can appear in all manner of formats, and may include individual textual labels describing the datum associated with the indicated position in the chart. The data may appear as dots or shapes, connected or unconnected, and in any combination of colors and patterns. Inferences or points of interest can be overlaid directly on the graph to further aid information extraction.
When the data appearing in a chart contains multiple variables, the chart may include a legend (also known as a key). A legend contains a list of the variables appearing in the chart and an example of their appearance. This information allows the data from each variable to be identified in the chart." [Chart. Wikipedia]
The vector stencils library "Time series charts" contains 10 templates: 3 column charts, 3 bar charts, 2 line graphs and 2 dot plots. All these charts are Live Objects displaying the data from external data source files.
Use these chart templates to design your business performance digital dashboards using the ConceptDraw PRO diagramming and vector drawing software.
The example "Design elements - Time series charts" is included in the Time Series Dashboard solution from the area "What is a Dashboard" of ConceptDraw Solution Park.
Time series charts

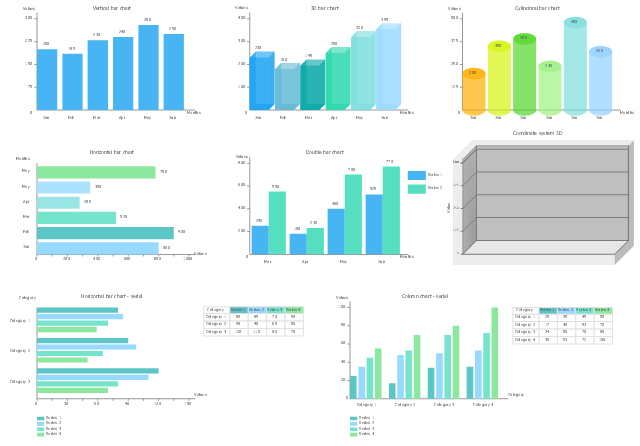
The vector stencils library "Education charts" contains 12 graphs and charts: area chart, column chart, divided bar diagram, histogram, horizontal bar graph, line graph, pie chart, ring chart, scatter plot.
Use it to create your educational infograms.
"A chart can take a large variety of forms, however there are common features that provide the chart with its ability to extract meaning from data.
Typically the data in a chart is represented graphically, since humans are generally able to infer meaning from pictures quicker than from text. Text is generally used only to annotate the data.
One of the more important uses of text in a graph is the title. A graph's title usually appears above the main graphic and provides a succinct description of what the data in the graph refers to.
Dimensions in the data are often displayed on axes. If a horizontal and a vertical axis are used, they are usually referred to as the x-axis and y-axis respectively. Each axis will have a scale, denoted by periodic graduations and usually accompanied by numerical or categorical indications. Each axis will typically also have a label displayed outside or beside it, briefly describing the dimension represented. If the scale is numerical, the label will often be suffixed with the unit of that scale in parentheses. ...
The data of a chart can appear in all manner of formats, and may include individual textual labels describing the datum associated with the indicated position in the chart. The data may appear as dots or shapes, connected or unconnected, and in any combination of colors and patterns. Inferences or points of interest can be overlaid directly on the graph to further aid information extraction.
When the data appearing in a chart contains multiple variables, the chart may include a legend (also known as a key). A legend contains a list of the variables appearing in the chart and an example of their appearance. This information allows the data from each variable to be identified in the chart." [Chart. Wikipedia]
The shapes example "Design elements - Education charts" was created using the ConceptDraw PRO diagramming and vector drawing software extended with the Education Infographics solition from the area "Business Infographics" in ConceptDraw Solution Park.
Graphs and charts

Diagramming Software for Design UML Package Diagrams


Spatial infographics Design Elements: Transport Map

Export from ConceptDraw DIAGRAM Document to a Graphic File

ConceptDraw DIAGRAM can save your drawings and diagrams in a number of highly useful formats, including graphic files. You can save your drawing as a.PNG,.JPG, or other graphic format file.

The vector stencils library Correlation charts from the Corellation Dashboard solution contains 4 templates of scatter plots for drawing the visual dashboards using the ConceptDraw PRO diagramming and vector drawing software.
"A scatter plot, scatterplot, or scattergraph is a type of mathematical diagram using Cartesian coordinates to display values for two variables for a set of data.
The data is displayed as a collection of points, each having the value of one variable determining the position on the horizontal axis and the value of the other variable determining the position on the vertical axis. This kind of plot is also called a scatter chart, scattergram, scatter diagram, or scatter graph." [Scatter plot. Wikipedia]
The example "Design elements - Correlation charts" is included in the Corellation Dashboard solution from the area "What is a Dashboard" of ConceptDraw Solution Park.
Scatter graphs

 Business Diagrams Package
Business Diagrams Package is a large set of comprehensive graphical solutions from the ConceptDraw Solution Park, which are powerful in solving the business, marketing and quality tasks in completely different fields, such as finance, education, health food and cooking, HR, and many others. The tools of this package's solutions are a powerful assistant in drawing all diversity of Financial and Marketing infographics, Business process workflow diagrams, Organizational charts, Education infographics, Quality diagrams, Health food diagrams, HR flowcharts, as well as different graphics and charts, which depict the values of key business indicators, their dependencies, give the full understanding of a situation within a company and on the market.
Education Package
Education Package is a comprehensive set of multifarious graphical solutions from ConceptDraw Solution Park, collected together in help to ConceptDraw DIAGRAM users working in a field of science, education and training, which is aimed at improving the quality of education and helping to design with ease variety of interesting and colorful educational materials, diagrams, charts and maps. Use it to present the information and knowledge in an interesting, clear, structured and simple form to achieve a success in education and pedagogy, to maintain the interest of students and pupils throughout the whole learning process, at the lectures, lessons and even during independent work with additional materials, to contribute to better perception of scientific information by listeners during the conferences and reports.
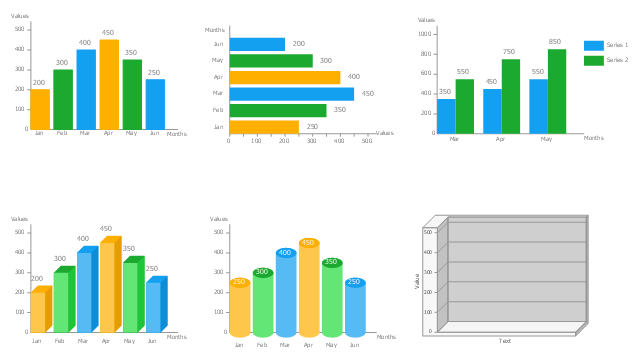
The vector stencils library "Bar charts" contains templates you can simply drag from the library to your document in the the ConceptDraw PRO diagramming and vector drawing software, and add your data.
"A bar chart or bar graph is a chart with rectangular bars with lengths proportional to the values that they represent. The bars can be plotted vertically or horizontally. A vertical bar chart is sometimes called a column bar chart. ...
A bar graph is a chart that uses either horizontal or vertical bars to show comparisons among categories. One axis of the chart shows the specific categories being compared, and the other axis represents a discrete value. Some bar graphs present bars clustered in groups of more than one (grouped bar graphs), and others show the bars divided into subparts to show cumulate effect (stacked bar graphs)." [Bar chart. Wikipedia]
The horizontal and vertical bar graphs example "Design elements - Bar charts" is included the Bar Graphs solution from the Statistical Charts and Diagrams area of ConceptDraw Solution Park.
Bar graph templates
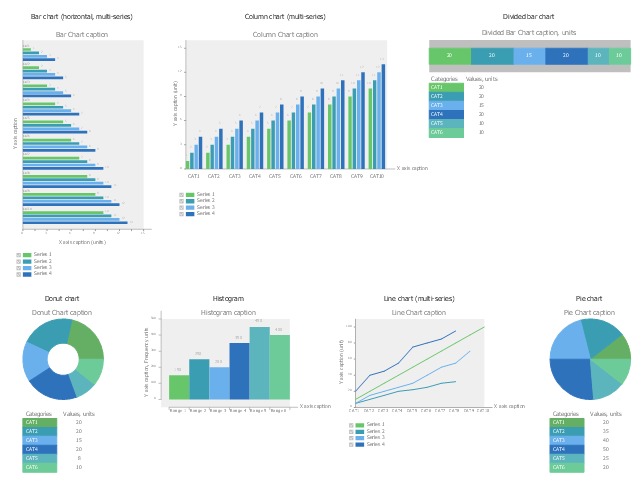
The vector stencils library "HR charts" contains 7 graphs: bar chart, column chart, divided bar chart, donut chart, histogram, line chart, pie chart.
Use it to design your human resources dashboards with ConceptDraw PRO software.
The graphs example "Design elements - HR charts" is included in HR Dashboard solution from Management area of ConceptDraw Solution Park.
Use it to design your human resources dashboards with ConceptDraw PRO software.
The graphs example "Design elements - HR charts" is included in HR Dashboard solution from Management area of ConceptDraw Solution Park.
Graphs
- Picture Graphs
- Design elements - Picture bar graphs | Design elements - Line ...
- Design elements - Picture bar graphs | Picture Graph Or Pictograph
- Picture graph - Template | Picture graph - Template | Design ...
- Design elements - Picture bar graphs
- Design elements - Picture bar graphs | Picture graphs - Vector ...
- Design elements - Scatter graphs | Scatter graphs - Vector stencils ...
- Design elements - Picture graphs | Picture graph - Template | Picture ...
- Design elements - Picture bar graphs | Design elements - Time ...
- Design elements - Marketing charts | Picture Graphs | Marketing ...
- Design elements - Picture graphs | How to Draw Pictorial Chart. How ...
- Barrie population - Picture bar graph | Design elements - Picture bar ...
- Design elements - Line graphs | Design elements - Time series ...
- Design elements - Picture bar graphs | Picture Graphs | Picture ...
- Create Graphs and Charts | Line Chart Template for Word | Design ...
- How to Create a Picture Graph in ConceptDraw PRO | Design ...
- Line Chart Examples | Design elements - Education charts | Design ...
- Design elements - Picture bar graphs
- Pictorial Chart
- Design elements - Picture bar graphs | Bar Chart Examples | Bar ...
- ERD | Entity Relationship Diagrams, ERD Software for Mac and Win
- Flowchart | Basic Flowchart Symbols and Meaning
- Flowchart | Flowchart Design - Symbols, Shapes, Stencils and Icons
- Flowchart | Flow Chart Symbols
- Electrical | Electrical Drawing - Wiring and Circuits Schematics
- Flowchart | Common Flowchart Symbols
- Flowchart | Common Flowchart Symbols