 Bar Graphs
Bar graphs solution extends ConceptDraw PRO software with templates, samples and library of vector stencils for drawing the bar charts.
Sales Growth. Bar Graphs Example

 Line Graphs
Line Graphs solution extends ConceptDraw PRO software with templates, samples and library of vector stencils for drawing the line charts.
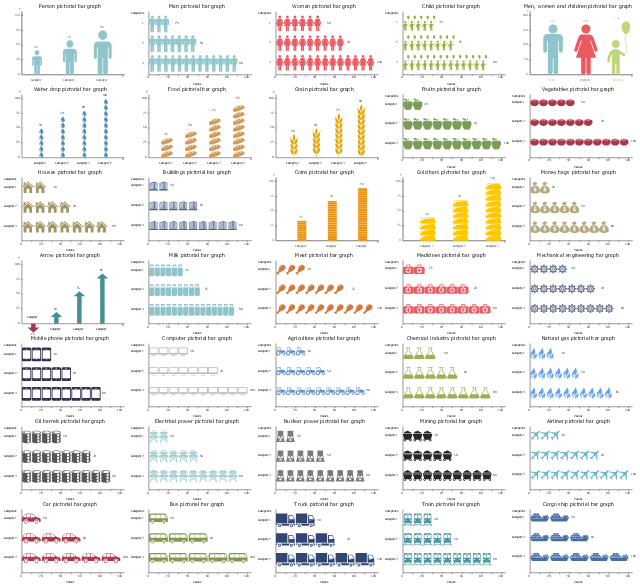
 Picture Graphs
Picture Graphs solution extends ConceptDraw PRO software with templates, samples and library of vector stencils for drawing the picture charts.
The Best Flowchart Software Available

ConceptDraw PRO vector diagramming and business graphics software enhanced with with templates, green and interactive flowchart makers, samples and stencil libraries from ConceptDraw Solution Park which all focused to help with drawing flowcharts, block diagrams, bar charts, histograms, pie charts, divided bar diagrams, line graphs, area charts, scatter plots, circular arrows diagrams, Venn diagrams, bubble diagrams, concept maps, and others.

Pictures of Graphs

"Pictorial bar graph.
Sometimes reffered to as a pictographs. A pictorial bar graph is a graph in which the rectangular bars have been filled with pictures, sketches, icons, etc. or where pictures, sketches, icons, etc. have been substituted for the rectangular bars. In both variations, one or more symbols might be used in each bar. The two major reasons for using pictorial graphs are to make the graph more appealing visually and to facilitate better communications." [Information Graphics: A Comprehensive Illustrated Reference. R. L. Harris. 1999. p.41]
The example"Design elements - Picture graphs" was created using the ConceptDraw PRO diagramming and vector drawing software extended with the Picture Graphs solution from the Graphs and Charts area of ConceptDraw Solution Park.
Pictorial chart templates
 ConceptDraw Solution Park
ConceptDraw Solution Park collects graphic extensions, examples and learning materials
Create Graphs and Charts

The vector stencils library "Picture Graphs" contains templates of picture bar graphs for visual data comparison. Use these shapes to draw your pictorial bar charts in the ConceptDraw PRO diagramming and vector drawing software extended with the Picture Graphs solution from the Graphs and Charts area of ConceptDraw Solution Park.
Arrow picture graph (control dots)
Arrow picture graph (text -> height)
Picture graph (person)
-picture-graphs---vector-stencils-library.png--diagram-flowchart-example.png)
Picture graph (coins)
-picture-graphs---vector-stencils-library.png--diagram-flowchart-example.png)
Basic Diagramming

HelpDesk
How to Create a Picture Graph in ConceptDraw PRO

Financial Comparison Chart

Bar Diagrams for Problem Solving. Create manufacturing and economics bar charts with Bar Graphs Solution

"In elementary algebra, a quadratic equation (from the Latin quadratus for "square") is any equation having the form
ax^2+bx+c=0
where x represents an unknown, and a, b, and c are constants with a not equal to 0. If a = 0, then the equation is linear, not quadratic. The constants a, b, and c are called, respectively, the quadratic coefficient, the linear coefficient and the constant or free term.
Because the quadratic equation involves only one unknown, it is called "univariate". The quadratic equation only contains powers of x that are non-negative integers, and therefore it is a polynomial equation, and in particular it is a second degree polynomial equation since the greatest power is two.
Quadratic equations can be solved by a process known in American English as factoring and in other varieties of English as factorising, by completing the square, by using the quadratic formula, or by graphing." [Quadratic equation. Wikipedia]
The flowchart example "Solving quadratic equation algorithm" was created using the ConceptDraw PRO diagramming and vector drawing software extended with the Mathematics solution from the Science and Education area of ConceptDraw Solution Park.
Solving quadratic equation flow chart

- | | Line Graphs | An Example Of Lines As A Graphing Designing ...
- Graphing Template
- ConceptDraw Solution Park | How to Create a Picture Graph in ...
- Best Graphing Software
- Picture graphs
- Sales Growth. Bar Graphs Example | Bar Diagrams for Problem ...
- Create Graphs and Charts | Sales Growth. Bar Graphs Example ...
- Sales Growth. Bar Graphs Example | Bar Chart Examples | Financial ...
- Bar Diagrams for Problem Solving. Create event management bar ...
- Sales Growth. Bar Graphs Example | Sales KPIs and Metrics - Vector ...
- Picture Graphs | How to Create a Picture Graph in ConceptDraw ...
- | | | Graphs Design
- Picture Graphs | Picture Graph | How to Create a Picture Graph in ...
- Picture Graphs
- Line Graphs | Line Graph Charting Software | Chart Maker for ...
- Polar Graph | Sales Growth. Bar Graphs Example | Picture Graph ...
- Line Graphs | Line Graph Charting Software | How to Draw a Line ...
- Line Graphs | Line Graph Charting Software | Line Graph | Line Graph
- How to Draw a Pictorial Chart in ConceptDraw PRO | Sample ...
- Bar Graphs | Sales Growth. Bar Graphs Example | Bar Graph | A ...
- ERD | Entity Relationship Diagrams, ERD Software for Mac and Win
- Flowchart | Basic Flowchart Symbols and Meaning
- Flowchart | Flowchart Design - Symbols, Shapes, Stencils and Icons
- Flowchart | Flow Chart Symbols
- Electrical | Electrical Drawing - Wiring and Circuits Schematics
- Flowchart | Common Flowchart Symbols
- Flowchart | Common Flowchart Symbols